MoneyGram 2011 Annual Report Download - page 56
Download and view the complete annual report
Please find page 56 of the 2011 MoneyGram annual report below. You can navigate through the pages in the report by either clicking on the pages listed below, or by using the keyword search tool below to find specific information within the annual report.-
 1
1 -
2
-
3
-
4
-
5
-
6
-
7
-
8
-
9
-
10
-
11
-
12
-
13
-
14
-
15
-
16
-
17
-
18
-
19
-
20
-
21
-
22
-
23
-
24
-
25
-
26
-
27
-
28
-
29
-
30
-
31
-
32
-
33
-
34
-
35
-
36
-
37
-
38
-
39
-
40
-
41
-
42
-
43
-
44
-
45
-
 46
46 -
 47
47 -
 48
48 -
 49
49 -
 50
50 -
 51
51 -
 52
52 -
 53
53 -
 54
54 -
 55
55 -
 56
56 -
 57
57 -
 58
58 -
 59
59 -
 60
60 -
 61
61 -
 62
62 -
 63
63 -
 64
64 -
 65
65 -
 66
66 -
67
-
68
-
69
-
70
-
71
-
72
-
73
-
74
-
75
-
76
-
77
-
78
-
79
-
80
-
81
-
82
-
83
-
84
-
85
-
86
-
87
-
88
-
89
-
90
-
91
-
92
-
93
-
94
-
95
-
96
-
97
-
98
-
99
-
100
-
101
-
102
-
103
-
104
-
105
-
106
-
107
-
108
-
109
-
110
-
111
-
112
-
113
-
114
-
115
-
116
-
117
-
118
-
119
-
120
-
121
-
122
-
123
-
124
-
125
-
126
-
127
-
128
-
129
-
130
-
131
-
132
-
133
-
134
-
135
-
136
-
137
-
138
-
139
-
140
-
141
-
142
-
143
-
144
-
145
-
146
-
147
-
148
-
149
-
150
-
151
-
152
-
153
-
154
-
155
-
156
-
157
-
158
-
159
-
160
-
161
-
162
-
163
-
164
-
165
-
166
-
167
-
168
-
169
-
170
-
171
-
172
-
173
-
174
-
175
-
176
-
177
-
178
-
179
-
180
-
181
-
182
-
183
-
184
-
185
-
186
-
187
-
188
-
189
-
190
-
191
-
192
-
193
-
194
-
195
-
196
-
197
-
198
-
199
-
200
-
201
-
202
-
203
-
204
-
205
-
206
-
207
-
208
-
209
-
210
-
211
-
212
-
213
-
214
-
215
-
216
-
217
-
218
-
219
-
220
-
221
-
222
-
223
-
224
-
225
-
226
-
227
-
228
-
229
-
230
-
231
-
232
-
233
-
234
-
235
-
236
-
237
-
238
-
239
-
240
-
241
-
242
-
243
-
244
-
245
-
246
-
247
-
248
-
249
 |
 |
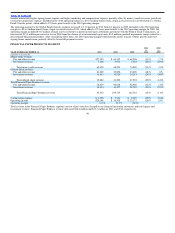
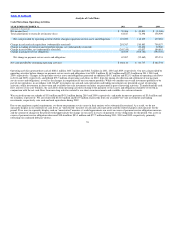
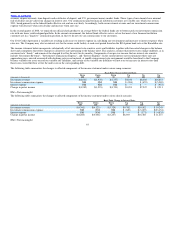
Table of Contents Analysis of Cash Flows
Cash Flows from Operating Activities
YEAR ENDED DECEMBER 31, 2011 2010 2009
(Amounts in thousands)
Net income (loss) $ 59,406 $ 43,801 $ (1,906)
Total adjustments to reconcile net income (loss) 61,617 72,398 158,909
Net cash provided by operating activities before changes in payment service assets and obligations 121,023 116,199 157,003
Change in cash and cash equivalents (substantially restricted) 291,767 510,883 700,557
Change in trading investments and related put options, net (substantially restricted) — 29,400 32,900
Change in receivables, net (substantially restricted) (245,319) 63,037 186,619
Change in payment service obligations 20,639 (658,782) (594,545)
Net change in payment service assets and obligations 67,087 (55,462) 325,531
Net cash provided by continuing operating activities $ 188,110 $ 60,737 $ 482,534
Operating activities generated net cash of $188.1 million, $60.7 million and $482.5 million in 2011, 2010 and 2009, respectively. Our net cash provided by
operating activities before changes in payment service assets and obligations was $121.0 million, $116.2 million and $157.0 million in 2011, 2010 and
2009, respectively. Changes in our payment service assets and obligations generated an additional $67.1 million and $325.5 million of operating cash flows
in 2011 and 2009, respectively, and utilized $55.5 million of operating cash flows in 2010, from the timing of collection and settlement of our payment
service assets and obligations, as well as the changes in composition of our investment portfolio. While we consider our overall investment portfolio to be
part of our operations, in accordance with GAAP, investments in cash and cash equivalents and trading investments are presented as part of operating
activities, while investments in short−term and available−for−sale investment securities are presented as part of investing activities. To understand the cash
flow activity of our core business, the cash flows from operating activities relating to the payment service assets and obligations should be reviewed in
conjunction with the net cash flows from investing activities related to our short−term investments and available−for−sale investments.
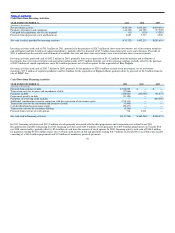
We received income tax refunds of $3.8 million and $43.5 million during 2010 and 2009, respectively, and made income tax payments of $3.9 million and
$2.2 million, respectively. We also reinvested $141.0 million and $32.9 million of proceeds from our available−for−sale investments and trading
investments, respectively, into cash and cash equivalents during 2009.
Due to our regulatory capital requirements, we deem our payment service assets in their entirety to be substantially restricted. As a result, we do not
separately display in our statement of cash flows an “unrestricted” measure of cash and cash equivalents and the related change in such measure for the
period. If we were to separately display such an “unrestricted” measure, it would approximate our assets in excess of payment service obligations measure,
and the amount of change for the period would approximate the change in our assets in excess of payment service obligations for the period. Our assets in
excess of payment service obligations decreased $18.6 million, $83.1 million and $77.7 million during 2011, 2010 and 2009, respectively, primarily
reflecting our continued debt pay−downs.
55