MoneyGram 2011 Annual Report Download - page 55
Download and view the complete annual report
Please find page 55 of the 2011 MoneyGram annual report below. You can navigate through the pages in the report by either clicking on the pages listed below, or by using the keyword search tool below to find specific information within the annual report.-
 1
1 -
2
-
3
-
4
-
5
-
6
-
7
-
8
-
9
-
10
-
11
-
12
-
13
-
14
-
15
-
16
-
17
-
18
-
19
-
20
-
21
-
22
-
23
-
24
-
25
-
26
-
27
-
28
-
29
-
30
-
31
-
32
-
33
-
34
-
35
-
36
-
37
-
38
-
39
-
40
-
41
-
42
-
43
-
44
-
 45
45 -
 46
46 -
 47
47 -
 48
48 -
 49
49 -
 50
50 -
 51
51 -
 52
52 -
 53
53 -
 54
54 -
 55
55 -
 56
56 -
 57
57 -
 58
58 -
 59
59 -
 60
60 -
 61
61 -
 62
62 -
 63
63 -
 64
64 -
 65
65 -
66
-
67
-
68
-
69
-
70
-
71
-
72
-
73
-
74
-
75
-
76
-
77
-
78
-
79
-
80
-
81
-
82
-
83
-
84
-
85
-
86
-
87
-
88
-
89
-
90
-
91
-
92
-
93
-
94
-
95
-
96
-
97
-
98
-
99
-
100
-
101
-
102
-
103
-
104
-
105
-
106
-
107
-
108
-
109
-
110
-
111
-
112
-
113
-
114
-
115
-
116
-
117
-
118
-
119
-
120
-
121
-
122
-
123
-
124
-
125
-
126
-
127
-
128
-
129
-
130
-
131
-
132
-
133
-
134
-
135
-
136
-
137
-
138
-
139
-
140
-
141
-
142
-
143
-
144
-
145
-
146
-
147
-
148
-
149
-
150
-
151
-
152
-
153
-
154
-
155
-
156
-
157
-
158
-
159
-
160
-
161
-
162
-
163
-
164
-
165
-
166
-
167
-
168
-
169
-
170
-
171
-
172
-
173
-
174
-
175
-
176
-
177
-
178
-
179
-
180
-
181
-
182
-
183
-
184
-
185
-
186
-
187
-
188
-
189
-
190
-
191
-
192
-
193
-
194
-
195
-
196
-
197
-
198
-
199
-
200
-
201
-
202
-
203
-
204
-
205
-
206
-
207
-
208
-
209
-
210
-
211
-
212
-
213
-
214
-
215
-
216
-
217
-
218
-
219
-
220
-
221
-
222
-
223
-
224
-
225
-
226
-
227
-
228
-
229
-
230
-
231
-
232
-
233
-
234
-
235
-
236
-
237
-
238
-
239
-
240
-
241
-
242
-
243
-
244
-
245
-
246
-
247
-
248
-
249
 |
 |

Table of Contents
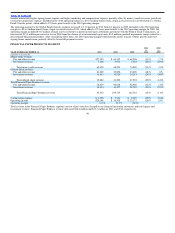
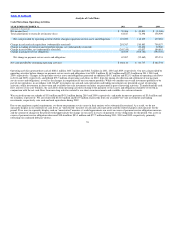
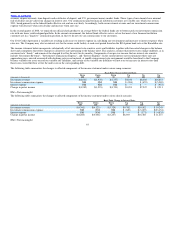
Debt consists of amounts outstanding under our 2011 Credit Agreement and the Second Lien Notes at December 31, 2011, as shown in Schedule of Credit
Facilities, as well as related interest payments, facility fees and annual commitment fees. Our Consolidated Balance Sheet at December 31, 2011 includes
$810.9 million of debt, net of unamortized discounts of $3.7 million, and $0.3 million of accrued interest on the debt. The above table reflects the principal
and interest that will be paid through the maturity of the debt using the rates in effect on December 31, 2011, and assuming no prepayments of principal and
the continued payment of interest on the Second Lien Notes. Operating leases consist of various leases for buildings and equipment used in our business.
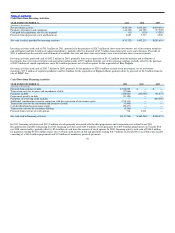
Signing bonuses are payments to certain agents and financial institution customers as an incentive to enter into long−term contracts. Marketing and signage
are purchase order commitments. Other obligations are unfunded capital commitments related to our limited partnership interests included in “Other
asset−backed securities” in our investment portfolio. We have other commitments as described further below that are not included in this table as the timing
and/or amount of payments are difficult to estimate.
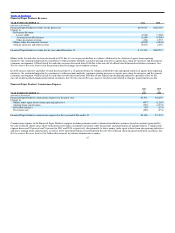
We have a funded, noncontributory pension plan that is frozen to both future benefit accruals and new participants. Our funding policy has historically been
to contribute the minimum contribution required by applicable regulations. We made contributions of $7.9 million to the defined benefit pension plan during
2011. We anticipate a minimum contribution of up to $10.2 million to the pension plan trust in 2012. We also have certain unfunded pension and
postretirement plans that require benefit payments over extended periods of time. During 2011, we paid benefits totaling $4.6 million related to these
unfunded plans. Benefit payments under these unfunded plans are expected to be $4.1 million in 2012. Expected contributions and benefit payments under
these plans are not included in the above table, as it is difficult to estimate the timing and amount of benefit payments and required contributions beyond the
next 12 months. See Note 10 — Pensions and Other Benefits of the Notes to the Consolidated Financial Statements for further information.
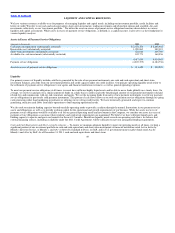
The liability for unrecognized tax benefits was $9.6 million as of December 31, 2011. In addition, the Company expects to receive Notices of Deficiency
from the IRS disallowing cumulative deductions taken for 2007, 2008 and 2009. If the Notices of Deficiency contain adjustments with which the Company
does not agree, the Company anticipates that it will file a petition in the United States Tax Court contesting such adjustments. While we believe the
Company’s position will be sustained, if the Company’s petition is denied in its entirety, the Company would be required to make cash payments of $105.4
million based on benefits taken through December 31, 2011. As there is a high degree of uncertainty regarding the timing of potential future cash outflows
associated with liabilities, we are unable to make a reasonably reliable estimate of the amount and period in which these liabilities might be paid. These
amounts are excluded from the table above as there is a high degree of uncertainty regarding the amount and timing of future cash outflows.
In limited circumstances, we may grant minimum commission guarantees as an incentive to new or renewing agents for a specified period of time at a
contractually specified amount. Under the guarantees, we will pay to the agent the difference between the contractually specified minimum commission and
the actual commissions earned by the agent. As of December 31, 2011, the minimum commission guarantees had a maximum payment of $7.2 million over
a weighted average remaining term of 3.5 years. The maximum payment is calculated as the contractually guaranteed minimum commission times the
remaining term of the contract and, therefore, assumes that the agent generates no money transfer transactions during the remainder of its contract. As of
December 31, 2011, the liability for minimum commission guarantees is $1.7 million. Minimum commission guarantees are not reflected in the table above.
54