MoneyGram 2011 Annual Report Download - page 45
Download and view the complete annual report
Please find page 45 of the 2011 MoneyGram annual report below. You can navigate through the pages in the report by either clicking on the pages listed below, or by using the keyword search tool below to find specific information within the annual report.-
 1
1 -
2
-
3
-
4
-
5
-
6
-
7
-
8
-
9
-
10
-
11
-
12
-
13
-
14
-
15
-
16
-
17
-
18
-
19
-
20
-
21
-
22
-
23
-
24
-
25
-
26
-
27
-
28
-
29
-
30
-
31
-
32
-
33
-
34
-
 35
35 -
 36
36 -
 37
37 -
 38
38 -
 39
39 -
 40
40 -
 41
41 -
 42
42 -
 43
43 -
 44
44 -
 45
45 -
 46
46 -
 47
47 -
 48
48 -
 49
49 -
 50
50 -
 51
51 -
 52
52 -
 53
53 -
 54
54 -
 55
55 -
56
-
57
-
58
-
59
-
60
-
61
-
62
-
63
-
64
-
65
-
66
-
67
-
68
-
69
-
70
-
71
-
72
-
73
-
74
-
75
-
76
-
77
-
78
-
79
-
80
-
81
-
82
-
83
-
84
-
85
-
86
-
87
-
88
-
89
-
90
-
91
-
92
-
93
-
94
-
95
-
96
-
97
-
98
-
99
-
100
-
101
-
102
-
103
-
104
-
105
-
106
-
107
-
108
-
109
-
110
-
111
-
112
-
113
-
114
-
115
-
116
-
117
-
118
-
119
-
120
-
121
-
122
-
123
-
124
-
125
-
126
-
127
-
128
-
129
-
130
-
131
-
132
-
133
-
134
-
135
-
136
-
137
-
138
-
139
-
140
-
141
-
142
-
143
-
144
-
145
-
146
-
147
-
148
-
149
-
150
-
151
-
152
-
153
-
154
-
155
-
156
-
157
-
158
-
159
-
160
-
161
-
162
-
163
-
164
-
165
-
166
-
167
-
168
-
169
-
170
-
171
-
172
-
173
-
174
-
175
-
176
-
177
-
178
-
179
-
180
-
181
-
182
-
183
-
184
-
185
-
186
-
187
-
188
-
189
-
190
-
191
-
192
-
193
-
194
-
195
-
196
-
197
-
198
-
199
-
200
-
201
-
202
-
203
-
204
-
205
-
206
-
207
-
208
-
209
-
210
-
211
-
212
-
213
-
214
-
215
-
216
-
217
-
218
-
219
-
220
-
221
-
222
-
223
-
224
-
225
-
226
-
227
-
228
-
229
-
230
-
231
-
232
-
233
-
234
-
235
-
236
-
237
-
238
-
239
-
240
-
241
-
242
-
243
-
244
-
245
-
246
-
247
-
248
-
249
 |
 |

Table of Contents
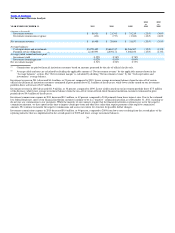
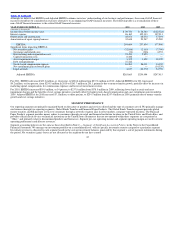
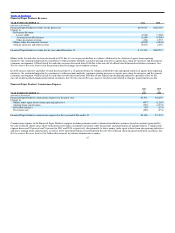
GLOBAL FUNDS TRANSFER SEGMENT
2011 2010
vs. vs.
YEAR ENDED DECEMBER 31, 2011 2010 2009 2010 2009
(Amounts in thousands)
Money transfer revenue:
Fee and other revenue $1,039,525 $ 926,489 $ 890,675 12% 4%
Investment revenue 562 244 163 130% 50%
Total money transfer revenue 1,040,087 926,733 890,838 12% 4%
Bill payment revenue:
Fee and other revenue 112,625 126,467 134,535 (11)% (6)%
Investment revenue 4 81 76 (95)% 7%
Total bill payment revenue 112,629 126,548 134,611 (11)% (6)%
Total Global Funds Transfer revenue:
Fee and other revenue 1,152,150 1,052,956 1,025,210 9% 3%
Investment revenue 566 325 239 74% 36%
Total Global Funds Transfer revenue 1,152,716 1,053,281 1,025,449 9% 3%
Commissions expense $ 545,688 $ 496,645 $ 488,116 10% 2%
Operating income $ 124,793 $ 139,314 $ 82,647 (10)% 69%
Operating margin 10.8% 13.2% 8.1%
Total revenue in the Global Funds Transfer segment consists primarily of fees on money transfers and bill payment transactions. For 2011 and 2010, Global
Funds Transfer total revenue increased $99.4 million and $27.8 million, respectively, driven by money transfer volume growth, partially offset by a decline
in bill payment revenue.
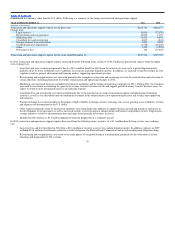
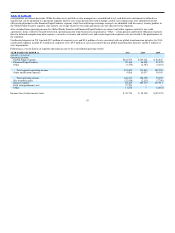
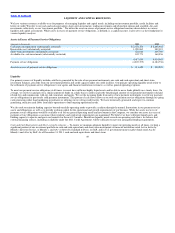
Money Transfer Fee and Other Revenue
YEAR ENDED DECEMBER 31, 2011 2010
(Amounts in thousands)
Money Transfer fee and other revenue for the prior year $ 926,489 $890,675
Change from:
Volume 126,673 77,441
Euro exchange rate 16,456 (18,088)
Corridor mix and average face value per transaction (19,889) 2,471
Introduction of $50 price band (9,286) (24,628)
Other (918) (1,382)
Money Transfer fee and other revenue for the year ended December 31, $1,039,525 $926,489
In 2011, money transfer fee and other revenue increased 12 percent, driven by transaction volume growth of 14 percent and a higher euro exchange rate,
partially offset by unfavorable changes in corridor mix, lower average face value per transaction and lower average money transfer fees from the $50 price
band in the United States.
In 2010, money transfer fee and other revenue increased four percent due to transaction volume growth of nine percent, favorable changes in corridor mix
and higher average face value per transaction, partially offset by lower average money transfer fees from the introduction of the $50 price band in the
United States and the lower Euro exchange rate. In addition, money transfer fee and other revenue in 2009 included $1.3 million of early termination fees.
44