MoneyGram 2011 Annual Report Download - page 57
Download and view the complete annual report
Please find page 57 of the 2011 MoneyGram annual report below. You can navigate through the pages in the report by either clicking on the pages listed below, or by using the keyword search tool below to find specific information within the annual report.-
 1
1 -
2
-
3
-
4
-
5
-
6
-
7
-
8
-
9
-
10
-
11
-
12
-
13
-
14
-
15
-
16
-
17
-
18
-
19
-
20
-
21
-
22
-
23
-
24
-
25
-
26
-
27
-
28
-
29
-
30
-
31
-
32
-
33
-
34
-
35
-
36
-
37
-
38
-
39
-
40
-
41
-
42
-
43
-
44
-
45
-
46
-
 47
47 -
 48
48 -
 49
49 -
 50
50 -
 51
51 -
 52
52 -
 53
53 -
 54
54 -
 55
55 -
 56
56 -
 57
57 -
 58
58 -
 59
59 -
 60
60 -
 61
61 -
 62
62 -
 63
63 -
 64
64 -
 65
65 -
 66
66 -
 67
67 -
68
-
69
-
70
-
71
-
72
-
73
-
74
-
75
-
76
-
77
-
78
-
79
-
80
-
81
-
82
-
83
-
84
-
85
-
86
-
87
-
88
-
89
-
90
-
91
-
92
-
93
-
94
-
95
-
96
-
97
-
98
-
99
-
100
-
101
-
102
-
103
-
104
-
105
-
106
-
107
-
108
-
109
-
110
-
111
-
112
-
113
-
114
-
115
-
116
-
117
-
118
-
119
-
120
-
121
-
122
-
123
-
124
-
125
-
126
-
127
-
128
-
129
-
130
-
131
-
132
-
133
-
134
-
135
-
136
-
137
-
138
-
139
-
140
-
141
-
142
-
143
-
144
-
145
-
146
-
147
-
148
-
149
-
150
-
151
-
152
-
153
-
154
-
155
-
156
-
157
-
158
-
159
-
160
-
161
-
162
-
163
-
164
-
165
-
166
-
167
-
168
-
169
-
170
-
171
-
172
-
173
-
174
-
175
-
176
-
177
-
178
-
179
-
180
-
181
-
182
-
183
-
184
-
185
-
186
-
187
-
188
-
189
-
190
-
191
-
192
-
193
-
194
-
195
-
196
-
197
-
198
-
199
-
200
-
201
-
202
-
203
-
204
-
205
-
206
-
207
-
208
-
209
-
210
-
211
-
212
-
213
-
214
-
215
-
216
-
217
-
218
-
219
-
220
-
221
-
222
-
223
-
224
-
225
-
226
-
227
-
228
-
229
-
230
-
231
-
232
-
233
-
234
-
235
-
236
-
237
-
238
-
239
-
240
-
241
-
242
-
243
-
244
-
245
-
246
-
247
-
248
-
249
 |
 |

Table of Contents
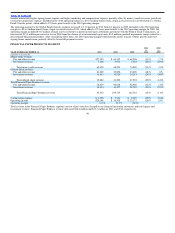
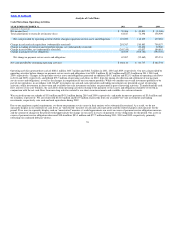
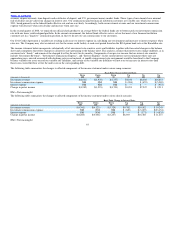
Cash Flows from Investing Activities
YEAR ENDED DECEMBER 31, 2011 2010 2009
(Amounts in thousands)
Net investment activity $(28,729) $135,216 $(259,001)
Purchases of property and equipment (44,223) (40,191) (37,948)
Cash paid for acquisitions, net of cash acquired (53) (330) (3,210)
Proceeds from disposal of assets and businesses 2,683 7,537 4,500
Net cash (used in) provided by investing activities $(70,322) $102,232 $(295,659)
Investing activities used cash of $70.3 million in 2011, primarily for the purchase of $28.7 million of short−term investments, net of investment maturities
and settlements and $44.2 million of capital expenditures, partially offset by proceeds of $2.7 million from disposal of assets and a business. Proceeds of
$511.6 million from the maturity and settlement of available−for−sale and short−term investments were reinvested into short−term investments.
Investing activities generated cash of $102.2 million in 2010, primarily from excess proceeds of $135.2 million from the maturity and settlement of
investments that were reinvested into cash equivalents and proceeds of $7.5 million from the sale of the corporate airplane, partially offset by the purchase
of $40.2 million of capital expenditures and a $0.3 million payment, net of cash acquired, for the acquisition of Blue Dolphin.
Investing activities used cash of $295.7 million in 2009, primarily for the purchase of $259.0 million of short−term investments, net of investment
maturities, $37.9 million of capital expenditures and $3.2 million for the acquisition of Raphaels Bank, partially offset by proceeds of $4.5 million from the
sale of FSMC, Inc.
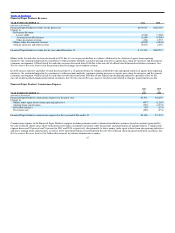
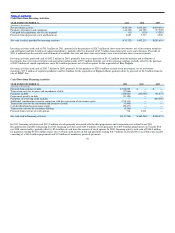
Cash Flows from Financing Activities
YEAR ENDED DECEMBER 31, 2011 2010 2009
(Amounts in thousands)
Proceeds from issuance of debt $ 536,025 $ — $ —
Transaction costs for issuance and amendment of debt (17,066) — —
Payments on debt (366,625) (165,000) (41,875)
Prepayment penalty on debt (23,188) — —
Payments on revolving credit facilities — — (145,000)
Additional consideration issued in connection with the conversion of mezzanine equity (218,333) — —
Transaction costs for the conversion and issuance of stock (5,444) — —
Cash dividend paid on mezzanine equity (20,477) — —
Transaction costs for the secondary offering (3,396) — —
Proceeds from exercise of stock options 716 2,031 —
Net cash used in financing activities $(117,788) $(162,969) $(186,875)
In 2011, financing activities used $117.8 million of cash primarily associated with the debt prepayments and transaction costs related to our 2011
Recapitalization and debt refinancing. In 2010, financing activities used $163.0 million of cash primarily for $165.0 million prepayments on Tranche B of
our 2008 senior facility, partially offset by $2.0 million of cash from the exercise of stock options. In 2009, financing activity used cash of $186.9 million
for payments totaling $145.0 million to pay our revolving credit facility in full and payments totaling $41.9 million on Tranche B of our 2008 senior facility,
consisting of a $40.0 million prepayment and $1.9 million of mandatory quarterly payments.
56