MoneyGram 2011 Annual Report Download - page 105
Download and view the complete annual report
Please find page 105 of the 2011 MoneyGram annual report below. You can navigate through the pages in the report by either clicking on the pages listed below, or by using the keyword search tool below to find specific information within the annual report.-
 1
1 -
2
-
3
-
4
-
5
-
6
-
7
-
8
-
9
-
10
-
11
-
12
-
13
-
14
-
15
-
16
-
17
-
18
-
19
-
20
-
21
-
22
-
23
-
24
-
25
-
26
-
27
-
28
-
29
-
30
-
31
-
32
-
33
-
34
-
35
-
36
-
37
-
38
-
39
-
40
-
41
-
42
-
43
-
44
-
45
-
46
-
47
-
48
-
49
-
50
-
51
-
52
-
53
-
54
-
55
-
56
-
57
-
58
-
59
-
60
-
61
-
62
-
63
-
64
-
65
-
66
-
67
-
68
-
69
-
70
-
71
-
72
-
73
-
74
-
75
-
76
-
77
-
78
-
79
-
80
-
81
-
82
-
83
-
84
-
85
-
86
-
87
-
88
-
89
-
90
-
91
-
92
-
93
-
94
-
 95
95 -
 96
96 -
 97
97 -
 98
98 -
 99
99 -
 100
100 -
 101
101 -
 102
102 -
 103
103 -
 104
104 -
 105
105 -
 106
106 -
 107
107 -
 108
108 -
 109
109 -
 110
110 -
 111
111 -
 112
112 -
 113
113 -
 114
114 -
 115
115 -
116
-
117
-
118
-
119
-
120
-
121
-
122
-
123
-
124
-
125
-
126
-
127
-
128
-
129
-
130
-
131
-
132
-
133
-
134
-
135
-
136
-
137
-
138
-
139
-
140
-
141
-
142
-
143
-
144
-
145
-
146
-
147
-
148
-
149
-
150
-
151
-
152
-
153
-
154
-
155
-
156
-
157
-
158
-
159
-
160
-
161
-
162
-
163
-
164
-
165
-
166
-
167
-
168
-
169
-
170
-
171
-
172
-
173
-
174
-
175
-
176
-
177
-
178
-
179
-
180
-
181
-
182
-
183
-
184
-
185
-
186
-
187
-
188
-
189
-
190
-
191
-
192
-
193
-
194
-
195
-
196
-
197
-
198
-
199
-
200
-
201
-
202
-
203
-
204
-
205
-
206
-
207
-
208
-
209
-
210
-
211
-
212
-
213
-
214
-
215
-
216
-
217
-
218
-
219
-
220
-
221
-
222
-
223
-
224
-
225
-
226
-
227
-
228
-
229
-
230
-
231
-
232
-
233
-
234
-
235
-
236
-
237
-
238
-
239
-
240
-
241
-
242
-
243
-
244
-
245
-
246
-
247
-
248
-
249
 |
 |
Table of Contents
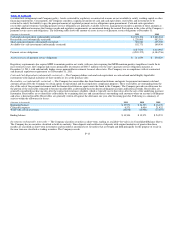
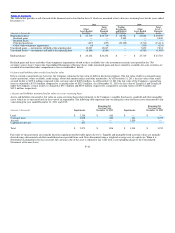
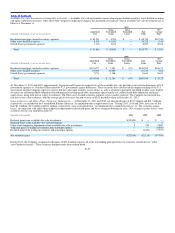
The table below provides a roll−forward of the financial assets classified in Level 3 which are measured at fair value on a recurring basis for the years ended
December 31:
2011 2010
Total Trading Total
Other Level 3 Investments Other Level 3
Asset−Backed Financial and Related Asset−Backed Financial
(Amounts in thousands) Securities Assets Put Options Securities Assets
Beginning balance $ 23,710 $23,710 $ 26,951 $ 22,088 $ 49,039
Realized gains — — 2,449 — 2,449
Realized losses — — — — —
Principal paydowns (657) (657) (29,400) (3,711) (33,111)
Other−than−temporary impairments (4) (4) — (334) (334)
Unrealized gains — instruments still held at the reporting date 10,047 10,047 — 7,632 7,632
Unrealized losses — instruments still held at the reporting date (8,864) (8,864) — (1,965) (1,965)
Ending balance $ 24,232 $24,232 $ — $ 23,710 $ 23,710
Realized gains and losses and other−than−temporary impairments related to these available−for−sale investment securities are reported in the “Net
securities (gains) losses” line in the Consolidated Statements of Income (Loss) while unrealized gains and losses related to available−for−sale securities are
recorded in accumulated other comprehensive loss in stockholders’ deficit.
b) Assets and liabilities that are disclosed at fair value
Debt is carried at amortized cost; however, the Company estimates the fair value of debt for disclosure purposes. The fair value of debt is estimated using
market quotations, where available, credit ratings, observable market indices and other market data. As of December 31, 2011, the fair value of the senior
secured facility is $479.8 million compared to the carrying value of $489.6 million. As of December 31, 2011 the fair value of the Company’s second lien
notes is estimated at $335.6 million compared to a carrying value of $325.0 million. As of December 31, 2010, the fair value of Tranche A and Tranche B
under the Company’s senior facility is estimated at $95.3 million and $40.0 million, respectively, compared to carrying values of $100.0 million and
$39.9 million, respectively.
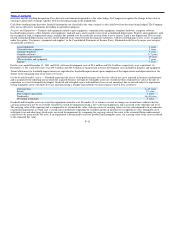
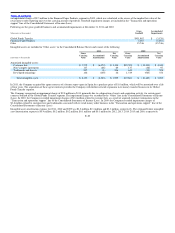
c) Assets and liabilities measured at fair value on a non−recurring basis
Assets and liabilities measured at fair value on a non−recurring basis relate primarily to the Company’s tangible fixed assets, goodwill and other intangible
assets which are re−measured only in the event of an impairment. The following table represents non−recurring fair value for those assets remeasured to fair
value during the year ended December 31, 2011 and 2010:
(Amounts in thousands) Impairments
Remaining Net
Carrying Value
December 31, 2011 Impairments
Remaining Net
Carrying Value
December 31, 2010
Land $ 2,356 $ 410 $ — $ —
Customer Lists 2,038 486 414 3,235
Aircraft — — 1,500 —
Capitalized software 677 — — —
Total $ 5,071 $ 896 $ 1,914 $ 3,235
Fair value re−measurements are normally based on significant unobservable inputs (Level 3). Tangible and intangible fixed asset fair values are normally
derived using a discounted cash flow model based on expected future cash flows discounted using a weighted−average cost of capital rate. When it is
determined an impairment loss has occurred, the carrying value of the asset is reduced to fair value with a corresponding charge to the Consolidated
Statements of Income (Loss).
F−23