MoneyGram 2011 Annual Report Download - page 33
Download and view the complete annual report
Please find page 33 of the 2011 MoneyGram annual report below. You can navigate through the pages in the report by either clicking on the pages listed below, or by using the keyword search tool below to find specific information within the annual report.-
 1
1 -
2
-
3
-
4
-
5
-
6
-
7
-
8
-
9
-
10
-
11
-
12
-
13
-
14
-
15
-
16
-
17
-
18
-
19
-
20
-
21
-
22
-
 23
23 -
 24
24 -
 25
25 -
 26
26 -
 27
27 -
 28
28 -
 29
29 -
 30
30 -
 31
31 -
 32
32 -
 33
33 -
 34
34 -
 35
35 -
 36
36 -
 37
37 -
 38
38 -
 39
39 -
 40
40 -
 41
41 -
 42
42 -
 43
43 -
44
-
45
-
46
-
47
-
48
-
49
-
50
-
51
-
52
-
53
-
54
-
55
-
56
-
57
-
58
-
59
-
60
-
61
-
62
-
63
-
64
-
65
-
66
-
67
-
68
-
69
-
70
-
71
-
72
-
73
-
74
-
75
-
76
-
77
-
78
-
79
-
80
-
81
-
82
-
83
-
84
-
85
-
86
-
87
-
88
-
89
-
90
-
91
-
92
-
93
-
94
-
95
-
96
-
97
-
98
-
99
-
100
-
101
-
102
-
103
-
104
-
105
-
106
-
107
-
108
-
109
-
110
-
111
-
112
-
113
-
114
-
115
-
116
-
117
-
118
-
119
-
120
-
121
-
122
-
123
-
124
-
125
-
126
-
127
-
128
-
129
-
130
-
131
-
132
-
133
-
134
-
135
-
136
-
137
-
138
-
139
-
140
-
141
-
142
-
143
-
144
-
145
-
146
-
147
-
148
-
149
-
150
-
151
-
152
-
153
-
154
-
155
-
156
-
157
-
158
-
159
-
160
-
161
-
162
-
163
-
164
-
165
-
166
-
167
-
168
-
169
-
170
-
171
-
172
-
173
-
174
-
175
-
176
-
177
-
178
-
179
-
180
-
181
-
182
-
183
-
184
-
185
-
186
-
187
-
188
-
189
-
190
-
191
-
192
-
193
-
194
-
195
-
196
-
197
-
198
-
199
-
200
-
201
-
202
-
203
-
204
-
205
-
206
-
207
-
208
-
209
-
210
-
211
-
212
-
213
-
214
-
215
-
216
-
217
-
218
-
219
-
220
-
221
-
222
-
223
-
224
-
225
-
226
-
227
-
228
-
229
-
230
-
231
-
232
-
233
-
234
-
235
-
236
-
237
-
238
-
239
-
240
-
241
-
242
-
243
-
244
-
245
-
246
-
247
-
248
-
249
 |
 |
Table of Contents
These cash balances are available to us for investment until the payment instrument is presented for payment. Investment revenue varies depending on the
level of investment balances and the yield on our investments. Investment balances vary based on the number of payment instruments sold, the principal
amount of those payment instruments and the length of time that passes until the instruments are presented for payment.
Fee and other commissions expense — We incur fee commissions primarily on our money transfer products. In a money transfer transaction, both the agent
initiating the transaction and the agent disbursing the funds receive a commission that is generally based on a percentage of the fee charged to the consumer.
We generally do not pay commissions to agents on the sale of money orders. In certain limited circumstances for large agents, we may pay a fixed
commission amount based on money order volumes transacted by that agent. Other commissions expense includes the amortization of capitalized agent
signing bonus payments.
Investment commissions expense — Investment commissions consist of amounts paid to financial institution customers based on short−term interest rate
indices times the average outstanding cash balances of official checks sold by that financial institution.
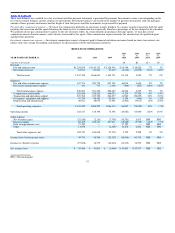
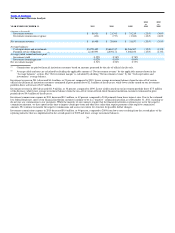
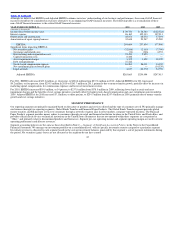
RESULTS OF OPERATIONS
2011 2010 2011 2010
vs. vs. vs. vs.
YEAR ENDED DECEMBER 31, 2011 2010 2009 2010 2009 2010 2009
(Amounts in thousands) ($) ($) (%) (%)
Revenue
Fee and other revenue $1,230,858 $1,145,312 $1,128,492 $ 85,546 $ 16,820 7% 1%
Investment revenue 16,911 21,341 33,219 (4,430) (11,878) (21)% (36)%
Total revenue 1,247,769 1,166,653 1,161,711 81,116 4,942 7% 0%
Expenses
Fee and other commissions expense 547,573 500,759 497,105 46,814 3,654 9% 1%
Investment commissions expense 431 737 1,362 (306) (625) (42)% (46)%
Total commissions expense 548,004 501,496 498,467 46,508 3,029 9% 1%
Compensation and benefits 235,696 226,422 199,053 9,274 27,369 4% 14%
Transaction and operations support 227,762 185,782 284,277 41,980 (98,495) 23% (35)%
Occupancy, equipment and supplies 47,739 46,481 47,425 1,258 (944) 3% (2)%
Depreciation and amortization 46,051 48,074 57,091 (2,023) (9,017) (4)% (16)%
Total operating expenses 1,105,252 1,008,255 1,086,313 96,997 (78,058) 10% (7)%
Operating income 142,517 158,398 75,398 (15,881) 83,000 (10)% 110%
Other expense
Net securities gains (32,816) (2,115) (7,790) (30,701) 5,675 NM NM
Interest expense 86,165 102,133 107,911 (15,968) (5,778) (16)% (5)%
Debt extinguishment costs 37,522 — — 37,522 — NM NM
Other 11,876 — (2,401) 11,876 2,401 NM NM
Total other expenses, net 102,747 100,018 97,720 2,729 2,298 3% 2%
Income (loss) before income taxes 39,770 58,380 (22,322) (18,610) 80,702 NM NM
Income tax (benefit) expense (19,636) 14,579 (20,416) (34,215) 34,995 NM NM
Net income (loss) $ 59,406 $ 43,801 $ (1,906) $ 15,605 $ 45,707 NM NM
NM = Not meaningful
32