MoneyGram 2011 Annual Report Download - page 104
Download and view the complete annual report
Please find page 104 of the 2011 MoneyGram annual report below. You can navigate through the pages in the report by either clicking on the pages listed below, or by using the keyword search tool below to find specific information within the annual report.-
 1
1 -
2
-
3
-
4
-
5
-
6
-
7
-
8
-
9
-
10
-
11
-
12
-
13
-
14
-
15
-
16
-
17
-
18
-
19
-
20
-
21
-
22
-
23
-
24
-
25
-
26
-
27
-
28
-
29
-
30
-
31
-
32
-
33
-
34
-
35
-
36
-
37
-
38
-
39
-
40
-
41
-
42
-
43
-
44
-
45
-
46
-
47
-
48
-
49
-
50
-
51
-
52
-
53
-
54
-
55
-
56
-
57
-
58
-
59
-
60
-
61
-
62
-
63
-
64
-
65
-
66
-
67
-
68
-
69
-
70
-
71
-
72
-
73
-
74
-
75
-
76
-
77
-
78
-
79
-
80
-
81
-
82
-
83
-
84
-
85
-
86
-
87
-
88
-
89
-
90
-
91
-
92
-
93
-
 94
94 -
 95
95 -
 96
96 -
 97
97 -
 98
98 -
 99
99 -
 100
100 -
 101
101 -
 102
102 -
 103
103 -
 104
104 -
 105
105 -
 106
106 -
 107
107 -
 108
108 -
 109
109 -
 110
110 -
 111
111 -
 112
112 -
 113
113 -
 114
114 -
115
-
116
-
117
-
118
-
119
-
120
-
121
-
122
-
123
-
124
-
125
-
126
-
127
-
128
-
129
-
130
-
131
-
132
-
133
-
134
-
135
-
136
-
137
-
138
-
139
-
140
-
141
-
142
-
143
-
144
-
145
-
146
-
147
-
148
-
149
-
150
-
151
-
152
-
153
-
154
-
155
-
156
-
157
-
158
-
159
-
160
-
161
-
162
-
163
-
164
-
165
-
166
-
167
-
168
-
169
-
170
-
171
-
172
-
173
-
174
-
175
-
176
-
177
-
178
-
179
-
180
-
181
-
182
-
183
-
184
-
185
-
186
-
187
-
188
-
189
-
190
-
191
-
192
-
193
-
194
-
195
-
196
-
197
-
198
-
199
-
200
-
201
-
202
-
203
-
204
-
205
-
206
-
207
-
208
-
209
-
210
-
211
-
212
-
213
-
214
-
215
-
216
-
217
-
218
-
219
-
220
-
221
-
222
-
223
-
224
-
225
-
226
-
227
-
228
-
229
-
230
-
231
-
232
-
233
-
234
-
235
-
236
-
237
-
238
-
239
-
240
-
241
-
242
-
243
-
244
-
245
-
246
-
247
-
248
-
249
 |
 |
Table of Contents
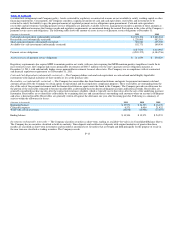
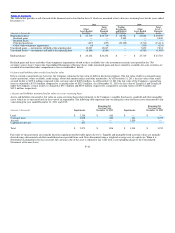
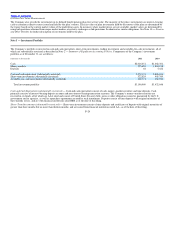
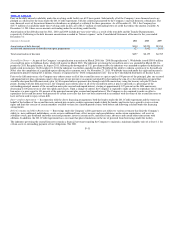
Following are the Company’s financial assets and liabilities measured at fair value by hierarchy level as of December 31:
Balance at
December 31,
2011
Fair Value at December 31, 2011
(Amounts in thousands) Level 1 Level 2 Level 3 Total
Financial assets:
Available−for−sale investments (substantially restricted):
United States government agencies $ 8,827 $ — $ 8,827 $ — $ 8,827
Residential mortgage−backed securities — agencies 69,712 — 69,712 — 69,712
Other asset−backed securities 24,232 — — 24,232 24,232
Investment related to deferred compensation trust 8,118 8,118 — — 8,118
Forward contracts 399 — 399 — 399
Total financial assets $ 111,288 $8,118 $78,938 $24,232 $111,288
Financial liabilities:
Forward contracts $ 46 $ — $ 46 $ — $ 46
Balance at
December 31,
2010
Fair Value at December 31, 2010
(Amounts in thousands) Level 1 Level 2 Level 3 Total
Available−for−sale investments (substantially restricted):
United States government agencies $ 8,641 $ — $ 8,641 $ — $ 8,641
Residential mortgage−backed securities — agencies 128,585 — 128,585 — 128,585
Other asset−backed securities 23,710 — — 23,710 23,710
Investment related to deferred compensation trust 10,693 10,693 — — 10,693
Forward contracts 1,117 — 1,117 — 1,117
Total financial assets $ 172,746 $10,693 $138,343 $23,710 $172,746
Financial liabilities:
Forward contracts $ 535 $ — $ 535 $ — $ 535
F−22