MoneyGram 2011 Annual Report Download - page 118
Download and view the complete annual report
Please find page 118 of the 2011 MoneyGram annual report below. You can navigate through the pages in the report by either clicking on the pages listed below, or by using the keyword search tool below to find specific information within the annual report.-
 1
1 -
2
-
3
-
4
-
5
-
6
-
7
-
8
-
9
-
10
-
11
-
12
-
13
-
14
-
15
-
16
-
17
-
18
-
19
-
20
-
21
-
22
-
23
-
24
-
25
-
26
-
27
-
28
-
29
-
30
-
31
-
32
-
33
-
34
-
35
-
36
-
37
-
38
-
39
-
40
-
41
-
42
-
43
-
44
-
45
-
46
-
47
-
48
-
49
-
50
-
51
-
52
-
53
-
54
-
55
-
56
-
57
-
58
-
59
-
60
-
61
-
62
-
63
-
64
-
65
-
66
-
67
-
68
-
69
-
70
-
71
-
72
-
73
-
74
-
75
-
76
-
77
-
78
-
79
-
80
-
81
-
82
-
83
-
84
-
85
-
86
-
87
-
88
-
89
-
90
-
91
-
92
-
93
-
94
-
95
-
96
-
97
-
98
-
99
-
100
-
101
-
102
-
103
-
104
-
105
-
106
-
107
-
 108
108 -
 109
109 -
 110
110 -
 111
111 -
 112
112 -
 113
113 -
 114
114 -
 115
115 -
 116
116 -
 117
117 -
 118
118 -
 119
119 -
 120
120 -
 121
121 -
 122
122 -
 123
123 -
 124
124 -
 125
125 -
 126
126 -
 127
127 -
 128
128 -
129
-
130
-
131
-
132
-
133
-
134
-
135
-
136
-
137
-
138
-
139
-
140
-
141
-
142
-
143
-
144
-
145
-
146
-
147
-
148
-
149
-
150
-
151
-
152
-
153
-
154
-
155
-
156
-
157
-
158
-
159
-
160
-
161
-
162
-
163
-
164
-
165
-
166
-
167
-
168
-
169
-
170
-
171
-
172
-
173
-
174
-
175
-
176
-
177
-
178
-
179
-
180
-
181
-
182
-
183
-
184
-
185
-
186
-
187
-
188
-
189
-
190
-
191
-
192
-
193
-
194
-
195
-
196
-
197
-
198
-
199
-
200
-
201
-
202
-
203
-
204
-
205
-
206
-
207
-
208
-
209
-
210
-
211
-
212
-
213
-
214
-
215
-
216
-
217
-
218
-
219
-
220
-
221
-
222
-
223
-
224
-
225
-
226
-
227
-
228
-
229
-
230
-
231
-
232
-
233
-
234
-
235
-
236
-
237
-
238
-
239
-
240
-
241
-
242
-
243
-
244
-
245
-
246
-
247
-
248
-
249
 |
 |

Table of Contents
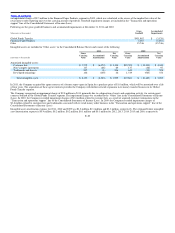
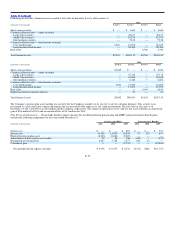
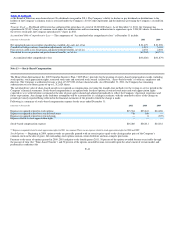
The Company recognized a net $1.5 million curtailment gain in 2009 from the amendment of two SERPs and accumulated participant terminations. The
amendment of the postretirement benefit plan resulted in a curtailment gain of $12.8 million in 2009. The postretirement benefits expense for 2011 and 2010
was reduced by less than $0.1 million and for 2009 it was reduced by $0.4 million due to subsidies received under the Medicare Prescription Drug,
Improvement and Modernization Act of 2003. The Company will not receive any subsidies in 2012.
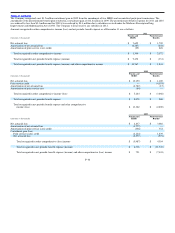
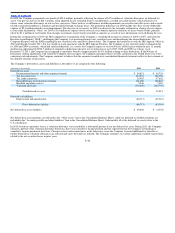
Amounts recognized in other comprehensive income (loss) and net periodic benefit expense as of December 31 are as follows:
2011
(Amounts in thousands) Pension and
SERPs Postretirement
Benefits
Net actuarial loss $ 7,625 $ 1,790
Amortization of net actuarial loss (6,287) (244)
Amortization of prior service (cost) credit (29) 626
Total recognized in other comprehensive income $ 1,309 $ 2,172
Total recognized in net periodic benefit expense (income) $ 9,458 $ (331)
Total recognized in net periodic benefit expense (income) and other comprehensive income $ 10,767 $ 1,841
2010
(Amounts in thousands) Pension and
SERPs Postretirement
Benefits
Net actuarial loss $ 10,150 $ 1,100
Prior service credit — (4,153)
Amortization of net actuarial loss (4,782) (15)
Amortization of prior service cost (84) —
Total recognized in other comprehensive income (loss) $ 5,284 $ (3,068)
Total recognized in net periodic benefit expense $ 8,078 $ 268
Total recognized in net periodic benefit expense and other comprehensive
income (loss) $ 13,362 $ (2,800)
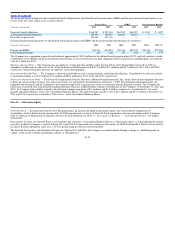
2009
(Amounts in thousands) Pension and
SERPs Postretirement
Benefits
Net actuarial loss $ 2,837 $ 3,086
Amortization of net actuarial loss (3,777) —
Amortization of prior service (cost) credit (346) 352
Curtailment gain (loss)
Prior service (costs) credit (2,124) 1,839
Net actuarial loss (2,577) (973)
Total recognized in other comprehensive (loss) income $ (5,987) $ 4,304
Total recognized in net periodic benefit expense (income) $ 6,738 $ (11,747)
Total recognized in net periodic benefit expense (income) and other comprehensive (loss) income $ 751 $ (7,443)
F−36