MoneyGram 2011 Annual Report Download - page 109
Download and view the complete annual report
Please find page 109 of the 2011 MoneyGram annual report below. You can navigate through the pages in the report by either clicking on the pages listed below, or by using the keyword search tool below to find specific information within the annual report.-
 1
1 -
2
-
3
-
4
-
5
-
6
-
7
-
8
-
9
-
10
-
11
-
12
-
13
-
14
-
15
-
16
-
17
-
18
-
19
-
20
-
21
-
22
-
23
-
24
-
25
-
26
-
27
-
28
-
29
-
30
-
31
-
32
-
33
-
34
-
35
-
36
-
37
-
38
-
39
-
40
-
41
-
42
-
43
-
44
-
45
-
46
-
47
-
48
-
49
-
50
-
51
-
52
-
53
-
54
-
55
-
56
-
57
-
58
-
59
-
60
-
61
-
62
-
63
-
64
-
65
-
66
-
67
-
68
-
69
-
70
-
71
-
72
-
73
-
74
-
75
-
76
-
77
-
78
-
79
-
80
-
81
-
82
-
83
-
84
-
85
-
86
-
87
-
88
-
89
-
90
-
91
-
92
-
93
-
94
-
95
-
96
-
97
-
98
-
 99
99 -
 100
100 -
 101
101 -
 102
102 -
 103
103 -
 104
104 -
 105
105 -
 106
106 -
 107
107 -
 108
108 -
 109
109 -
 110
110 -
 111
111 -
 112
112 -
 113
113 -
 114
114 -
 115
115 -
 116
116 -
 117
117 -
 118
118 -
 119
119 -
120
-
121
-
122
-
123
-
124
-
125
-
126
-
127
-
128
-
129
-
130
-
131
-
132
-
133
-
134
-
135
-
136
-
137
-
138
-
139
-
140
-
141
-
142
-
143
-
144
-
145
-
146
-
147
-
148
-
149
-
150
-
151
-
152
-
153
-
154
-
155
-
156
-
157
-
158
-
159
-
160
-
161
-
162
-
163
-
164
-
165
-
166
-
167
-
168
-
169
-
170
-
171
-
172
-
173
-
174
-
175
-
176
-
177
-
178
-
179
-
180
-
181
-
182
-
183
-
184
-
185
-
186
-
187
-
188
-
189
-
190
-
191
-
192
-
193
-
194
-
195
-
196
-
197
-
198
-
199
-
200
-
201
-
202
-
203
-
204
-
205
-
206
-
207
-
208
-
209
-
210
-
211
-
212
-
213
-
214
-
215
-
216
-
217
-
218
-
219
-
220
-
221
-
222
-
223
-
224
-
225
-
226
-
227
-
228
-
229
-
230
-
231
-
232
-
233
-
234
-
235
-
236
-
237
-
238
-
239
-
240
-
241
-
242
-
243
-
244
-
245
-
246
-
247
-
248
-
249
 |
 |

Table of Contents
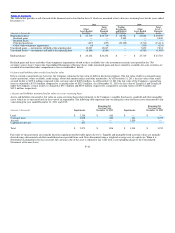
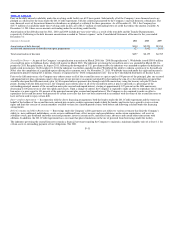
the Consolidated Statements of Income (Loss) includes the following losses (gains) related to assets and liabilities denominated in foreign currencies:
(Amounts in thousands) 2011 2010 2009
Net realized foreign currency losses $2,911 $ 7,204 $ 102
Net losses (gains) from the related forward contracts 5,748 (1,840) 5,189
Net losses (gains) from foreign currency transactions and related forward contracts $8,659 $ 5,364 $5,291
As of December 31, 2011 and 2010, the Company had $65.5 million and $123.8 million, respectively, of outstanding notional amounts relating to its
forward contracts. At December 31, the Company reflects the following fair values of derivative forward contract instruments in its Consolidated Balance
Sheets:
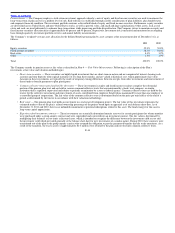
Balance Sheet
Location Derivative Assets Derivative
Liabilities
(Amounts in thousands) 2011 2010 2011 2010
Forward contracts Other assets $399 $1,117 $ 46 $535
The Company is exposed to credit loss in the event of non−performance by counterparties to its derivative contracts. Collateral generally is not required of
the counterparties or of the Company. In the unlikely event a counterparty fails to meet the contractual terms of the derivative contract, the Company’s risk
is limited to the fair value of the instrument. The Company actively monitors its exposure to credit risk through the use of credit approvals and credit limits,
and by selecting major international banks and financial institutions as counterparties. The Company has not had any historical instances of
non−performance by any counterparties, nor does it anticipate any future instances of non−performance.
Historically, the Company entered into foreign currency forward contracts with 12−month durations to hedge forecasted foreign currency money transfer
transactions. The Company designated these forward contracts as cash flow hedges. All cash flow hedges matured in 2009. For the year ended
December 31, 2009, the Company recognized a gain of $2.4 million in the “Other” expense line in the non−operating section of the Consolidated
Statements of Income (Loss). Included in this gain is $0.8 million of unrealized gains reclassified from “Accumulated other comprehensive income (loss)”
upon the final settlement of these cash flow hedges for the years ending December 31, 2009.
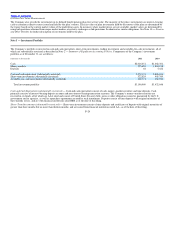
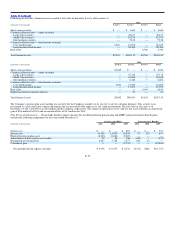
Note 7 — Property and Equipment
Property and equipment consists of the following at December 31:
(Amounts in thousands) 2011 2010
Computer hardware and software 196,168 187,604
Signage 80,303 62,774
Agent equipment 69,643 67,766
Office furniture and equipment 36,733 32,633
Leasehold improvements 27,562 23,947
Land 410 2,907
410,819 377,631
Accumulated depreciation (294,478) (262,520)
Total property and equipment $ 116,341 $ 115,111
F−27