MoneyGram 2011 Annual Report Download - page 50
Download and view the complete annual report
Please find page 50 of the 2011 MoneyGram annual report below. You can navigate through the pages in the report by either clicking on the pages listed below, or by using the keyword search tool below to find specific information within the annual report.-
 1
1 -
2
-
3
-
4
-
5
-
6
-
7
-
8
-
9
-
10
-
11
-
12
-
13
-
14
-
15
-
16
-
17
-
18
-
19
-
20
-
21
-
22
-
23
-
24
-
25
-
26
-
27
-
28
-
29
-
30
-
31
-
32
-
33
-
34
-
35
-
36
-
37
-
38
-
39
-
 40
40 -
 41
41 -
 42
42 -
 43
43 -
 44
44 -
 45
45 -
 46
46 -
 47
47 -
 48
48 -
 49
49 -
 50
50 -
 51
51 -
 52
52 -
 53
53 -
 54
54 -
 55
55 -
 56
56 -
 57
57 -
 58
58 -
 59
59 -
 60
60 -
61
-
62
-
63
-
64
-
65
-
66
-
67
-
68
-
69
-
70
-
71
-
72
-
73
-
74
-
75
-
76
-
77
-
78
-
79
-
80
-
81
-
82
-
83
-
84
-
85
-
86
-
87
-
88
-
89
-
90
-
91
-
92
-
93
-
94
-
95
-
96
-
97
-
98
-
99
-
100
-
101
-
102
-
103
-
104
-
105
-
106
-
107
-
108
-
109
-
110
-
111
-
112
-
113
-
114
-
115
-
116
-
117
-
118
-
119
-
120
-
121
-
122
-
123
-
124
-
125
-
126
-
127
-
128
-
129
-
130
-
131
-
132
-
133
-
134
-
135
-
136
-
137
-
138
-
139
-
140
-
141
-
142
-
143
-
144
-
145
-
146
-
147
-
148
-
149
-
150
-
151
-
152
-
153
-
154
-
155
-
156
-
157
-
158
-
159
-
160
-
161
-
162
-
163
-
164
-
165
-
166
-
167
-
168
-
169
-
170
-
171
-
172
-
173
-
174
-
175
-
176
-
177
-
178
-
179
-
180
-
181
-
182
-
183
-
184
-
185
-
186
-
187
-
188
-
189
-
190
-
191
-
192
-
193
-
194
-
195
-
196
-
197
-
198
-
199
-
200
-
201
-
202
-
203
-
204
-
205
-
206
-
207
-
208
-
209
-
210
-
211
-
212
-
213
-
214
-
215
-
216
-
217
-
218
-
219
-
220
-
221
-
222
-
223
-
224
-
225
-
226
-
227
-
228
-
229
-
230
-
231
-
232
-
233
-
234
-
235
-
236
-
237
-
238
-
239
-
240
-
241
-
242
-
243
-
244
-
245
-
246
-
247
-
248
-
249
 |
 |

Table of Contents LIQUIDITY AND CAPITAL RESOURCES
We have various resources available to us for purposes of managing liquidity and capital needs, including our investment portfolio, credit facilities and
letters of credit. We refer to our cash and cash equivalents, short−term investments, trading investments and related put options and available−for−sale
investments collectively as our “investment portfolio.” We utilize the assets in excess of payment service obligations measure shown below in various
liquidity and capital assessments. While assets in excess of payment service obligations, as defined, is a capital measure, it also serves as the foundation for
various liquidity analyses.
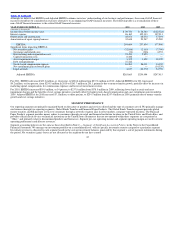
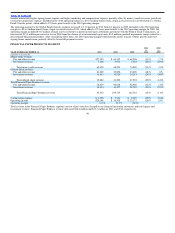
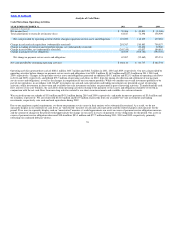
Assets in Excess of Payment Service Obligations
(Amounts in thousands) 2011 2010
Cash and cash equivalents (substantially restricted) $ 2,572,174 $ 2,865,941
Receivables, net (substantially restricted) 1,220,065 982,319
Short−term investments (substantially restricted) 522,024 405,769
Available−for−sale investments (substantially restricted) 102,771 160,936
4,417,034 4,414,965
Payment service obligations (4,205,375) (4,184,736)
Assets in excess of payment service obligations $ 211,659 $ 230,229
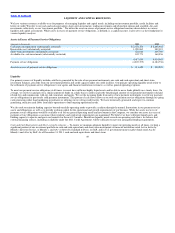
Liquidity
Our primary sources of liquidity include cash flows generated by the sale of our payment instruments, our cash and cash equivalent and short−term
investment balances, proceeds from our investment portfolio and credit capacity under our credit facilities. Our primary operating liquidity needs relate to
the settlement of payment service obligations to our agents and financial institution customers, as well as general operating expenses.
To meet our payment service obligations at all times, we must have sufficient highly liquid assets and be able to move funds globally on a timely basis. On
average, we receive in and pay out a similar amount of funds on a daily basis to collect and settle the principal amount of our payment instruments sold and
related fees and commissions with our end consumers and agents. We use the incoming funds from sales of new payment instruments to settle our payment
service obligations for previously sold payment instruments. This pattern of cash flows allows us to settle our payment service obligations through on−going
cash generation rather than liquidating investments or utilizing our revolving credit facility. We have historically generated, and expect to continue
generating, sufficient cash flows from daily operations to fund ongoing operational needs.
We also seek to maintain funding capacity beyond our daily operating needs to provide a cushion through the normal fluctuations in our payment service
assets and obligations, as well as to provide working capital for the operational and growth requirements of our business. While the assets in excess of
payment service obligations would be available to us for our general operating needs and investment in the Company, we consider our assets in excess of
payment service obligations as assurance that regulatory and contractual requirements are maintained. We believe we have sufficient liquid assets and
funding capacity to operate and grow our business for the next 12 months. Should our liquidity needs exceed our operating cash flows, we believe that
external financing sources, including availability under the 2011 Credit Agreement, will be sufficient to meet our anticipated funding requirements.
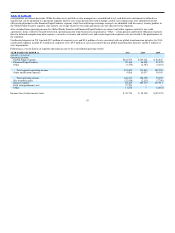
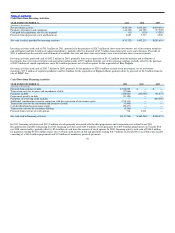
Cash and Cash Equivalents and Short−term Investments — To ensure we maintain adequate liquidity to meet our operating needs at all times, we keep a
significant portion of our investment portfolio in cash and cash equivalents and short−term investments at financial institutions rated Aa3 or better by
Moody’s Investor Service, or Moody’s, and AA− or better by Standard & Poors, or S&P, and in U.S. government money market funds rated Aaa by
Moody’s and AA+ by S&P. As of December 31, 2011, cash and cash equivalents and short−term
49