MoneyGram 2011 Annual Report Download - page 31
Download and view the complete annual report
Please find page 31 of the 2011 MoneyGram annual report below. You can navigate through the pages in the report by either clicking on the pages listed below, or by using the keyword search tool below to find specific information within the annual report.-
 1
1 -
2
-
3
-
4
-
5
-
6
-
7
-
8
-
9
-
10
-
11
-
12
-
13
-
14
-
15
-
16
-
17
-
18
-
19
-
20
-
 21
21 -
 22
22 -
 23
23 -
 24
24 -
 25
25 -
 26
26 -
 27
27 -
 28
28 -
 29
29 -
 30
30 -
 31
31 -
 32
32 -
 33
33 -
 34
34 -
 35
35 -
 36
36 -
 37
37 -
 38
38 -
 39
39 -
 40
40 -
 41
41 -
42
-
43
-
44
-
45
-
46
-
47
-
48
-
49
-
50
-
51
-
52
-
53
-
54
-
55
-
56
-
57
-
58
-
59
-
60
-
61
-
62
-
63
-
64
-
65
-
66
-
67
-
68
-
69
-
70
-
71
-
72
-
73
-
74
-
75
-
76
-
77
-
78
-
79
-
80
-
81
-
82
-
83
-
84
-
85
-
86
-
87
-
88
-
89
-
90
-
91
-
92
-
93
-
94
-
95
-
96
-
97
-
98
-
99
-
100
-
101
-
102
-
103
-
104
-
105
-
106
-
107
-
108
-
109
-
110
-
111
-
112
-
113
-
114
-
115
-
116
-
117
-
118
-
119
-
120
-
121
-
122
-
123
-
124
-
125
-
126
-
127
-
128
-
129
-
130
-
131
-
132
-
133
-
134
-
135
-
136
-
137
-
138
-
139
-
140
-
141
-
142
-
143
-
144
-
145
-
146
-
147
-
148
-
149
-
150
-
151
-
152
-
153
-
154
-
155
-
156
-
157
-
158
-
159
-
160
-
161
-
162
-
163
-
164
-
165
-
166
-
167
-
168
-
169
-
170
-
171
-
172
-
173
-
174
-
175
-
176
-
177
-
178
-
179
-
180
-
181
-
182
-
183
-
184
-
185
-
186
-
187
-
188
-
189
-
190
-
191
-
192
-
193
-
194
-
195
-
196
-
197
-
198
-
199
-
200
-
201
-
202
-
203
-
204
-
205
-
206
-
207
-
208
-
209
-
210
-
211
-
212
-
213
-
214
-
215
-
216
-
217
-
218
-
219
-
220
-
221
-
222
-
223
-
224
-
225
-
226
-
227
-
228
-
229
-
230
-
231
-
232
-
233
-
234
-
235
-
236
-
237
-
238
-
239
-
240
-
241
-
242
-
243
-
244
-
245
-
246
-
247
-
248
-
249
 |
 |

Table of Contents
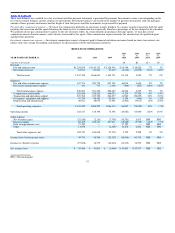
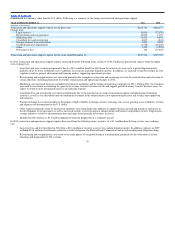
of presentation of the information set forth below, see “Management’s Discussion and Analysis of Financial Condition and Results of Operations — Basis
of Presentation.”
YEAR ENDED DECEMBER 31, 2011 2010 2009 2008 2007
(Dollars and shares in thousands, except per share data)
Operating Results
Revenue
Global Funds Transfer segment $1,152,716 $1,053,281 $1,025,449 $1,015,929 $ 861,403
Financial Paper Products segment 93,332 109,515 122,783 238,193 470,127
Other 1,721 3,857 13,479 16,459 18,463
Total revenue 1,247,769 1,166,653 1,161,711 1,270,581 1,349,993
Total operating expenses 1,105,252 1,008,255 1,086,313 1,151,760 1,139,749
Operating income 142,517 158,398 75,398 118,821 210,244
Total other expense, net (1) 102,747 100,018 97,720 456,012 1,203,512
Income (loss) from continuing operations before income taxes
(2) 39,770 58,380 (22,322) (337,191) (993,268)
Income tax expense (benefit) (19,636) 14,579 (20,416) (75,806) 78,481
Income (loss) from continuing operations $ 59,406 $ 43,801 $ (1,906) $ (261,385) $(1,071,749)
(Loss) earnings per common share:
Basic $ (9.03) $ (8.77) $ (11.87) $ (33.54) $ (103.55)
Diluted $ (9.03) $ (8.77) $ (11.87) $ (33.54) $ (103.55)
Weighted−average shares outstanding:
Basic 48,576 10,398 10,312 10,307 10,352
Diluted 48,576 10,398 10,312 10,307 10,352
Financial Position
Excess (shortfall) of assets over payment service obligations (3) $ 211,659 $ 230,229 $ 313,335 $ 391,031 $ (551,812)
Substantially restricted assets (3) 4,417,034 4,414,965 5,156,789 5,829,030 7,210,658
Total assets 5,175,578 5,115,736 5,929,663 6,642,296 7,935,011
Payment service obligations 4,205,375 4,184,736 4,843,454 5,437,999 7,762,470
Long−term debt 810,888 639,946 796,791 978,881 345,000
Mezzanine equity (4) — 999,353 864,328 742,212 —
Stockholders' (deficit) equity (4) (110,198) (942,482) (883,013) (781,736) (488,517)
Other Selected Data
Capital expenditures $ 50,136 $ 43,025 $ 38,258 $ 40,357 $ 71,142
Depreciation and amortization $ 46,051 $ 48,074 $ 57,091 $ 56,672 $ 51,979
Cash dividends declared per share $ — $ — $ — $ — $ 0.20
Average investable balances (5) $3,255,405 $3,684,317 $4,246,507 $4,866,339 $ 6,346,442
Net investment margin (6) 0.51% 0.56% 0.75% 1.23% 2.28%
Approximate number of countries and territories served 190 190 190 190 180
Number of money order locations (7) 45,000 46,000 49,000 59,000 59,000
Number of money transfer locations (7) 267,000 227,000 190,000 176,000 143,000
(1) Total other expense, net for 2011 includes net securities gains of $32.8 million from the receipt of settlements equal to all outstanding principal from
two securities classified in ‘other asset−backed securities’ previously written down to a nominal fair value and debt extinguishment costs of $37.5
million relating to the termination of the 2008 senior facility in connection with the 2011 Recapitalization and the partial redemption of the Second
Lien Notes. Total other expense, net for 2008 includes net securities losses of $340.7 million from the realignment of the investment portfolio in the
first quarter of 2008, other−than−temporary impairments and declines in the value of our trading investments. Total other expense, net for 2007
includes net losses of $1.2 billion related to other−than−temporary impairments in the Company’s investment portfolio.
(2) Income from continuing operations before income taxes for 2011 includes $4.8 million of legal accruals related primarily to shareholder litigation,
$3.4 million of asset impairments and $23.5 million of expense related to our global transformation initiative. Income from continuing operations
before income taxes for
30