MoneyGram 2011 Annual Report Download - page 90
Download and view the complete annual report
Please find page 90 of the 2011 MoneyGram annual report below. You can navigate through the pages in the report by either clicking on the pages listed below, or by using the keyword search tool below to find specific information within the annual report.
Table of Contents MONEYGRAM INTERNATIONAL, INC.
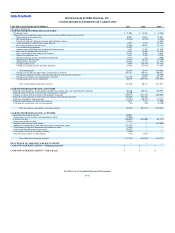
CONSOLIDATED STATEMENTS OF CASH FLOWS
FOR THE YEAR ENDED DECEMBER 31, 2011 2010 2009
(Amounts in thousands)
CASH FLOWS FROM OPERATING ACTIVITIES:
Net income (loss) $ 59,406 $ 43,801 $ (1,906)
Adjustments to reconcile net income (loss) to net cash provided by operating activities:
Depreciation and amortization 46,051 48,074 57,091
Net securities gain (32,816) (2,115) (3,486)
Unrealized gain on trading investments and related put options — — (4,304)
Asset impairments and net losses upon disposal 6,911 2,158 18,228
Provision for deferred income taxes (72,803) 10,023 (14,915)
Loss on debt extinguishment 37,522 — —
Amortization of debt discount and deferred financing costs 7,418 17,492 12,765
Provision for uncollectible receivables 6,571 6,404 21,432
Non−cash compensation and pension expense 25,767 35,106 9,608
Other non−cash items, net 3,837 2,347 5,390
Change in foreign currency translation adjustments (4,173) 232 (406)
Signing bonus amortization 32,618 29,247 35,280
Signing bonus payments (32,994) (27,172) (22,176)
Change in other assets 4,544 (16,545) 31,246
Change in accounts payable and other liabilities 33,164 (32,853) 13,156
Total adjustments 61,617 72,398 158,909
Change in cash and cash equivalents (substantially restricted) 291,767 510,883 700,557
Change in trading investments and related put options (substantially restricted) — 29,400 32,900
Change in receivables, net (substantially restricted) (245,319) 63,037 186,619
Change in payment service obligations 20,639 (658,782) (594,545)
Net cash provided by operating activities 188,110 60,737 482,534
CASH FLOWS FROM INVESTING ACTIVITIES:
Proceeds from maturities of investments classified as available−for−sale (substantially restricted) 56,320 140,985 140,999
Proceeds from settlement of investments (substantially restricted) 32,820 — —
Purchase of short−term investments (substantially restricted) (540,338) (707,137) (400,000)
Proceeds from maturities of short−term investments (substantially restricted) 422,469 701,368 —
Purchases of property and equipment (44,223) (40,191) (37,948)
Proceeds from disposal of assets and businesses 2,683 7,537 4,500
Cash paid for acquisitions, net of cash acquired (53) (330) (3,210)
Net cash (used in) provided by investing activities (70,322) 102,232 (295,659)
CASH FLOWS FROM FINANCING ACTIVITIES:
Proceeds from issuance of debt 536,025 — —
Transaction costs for issuance and amendment of debt (17,066) — —
Payments on debt (366,625) (165,000) (41,875)
Prepayment penalty on debt (23,188) — —
Payments on revolving credit facility — — (145,000)
Additional consideration issued from conversion of mezzanine equity (218,333) — —
Transaction costs for the conversion and issuance of stock (5,444) — —
Cash dividends paid on mezzanine equity (20,477) — —
Transaction costs for the secondary offering (3,396) — —
Proceeds from exercise of stock options 716 2,031 —
Net cash used in financing activities (117,788) (162,969) (186,875)
NET CHANGE IN CASH AND CASH EQUIVALENTS — — —
CASH AND CASH EQUIVALENTS — Beginning of period $ — $ — $ —
CASH AND CASH EQUIVALENTS — End of period $ — $ — $ —
See Notes to Consolidated Financial Statements
F−8


