MoneyGram 2011 Annual Report Download - page 119
Download and view the complete annual report
Please find page 119 of the 2011 MoneyGram annual report below. You can navigate through the pages in the report by either clicking on the pages listed below, or by using the keyword search tool below to find specific information within the annual report.-
 1
1 -
2
-
3
-
4
-
5
-
6
-
7
-
8
-
9
-
10
-
11
-
12
-
13
-
14
-
15
-
16
-
17
-
18
-
19
-
20
-
21
-
22
-
23
-
24
-
25
-
26
-
27
-
28
-
29
-
30
-
31
-
32
-
33
-
34
-
35
-
36
-
37
-
38
-
39
-
40
-
41
-
42
-
43
-
44
-
45
-
46
-
47
-
48
-
49
-
50
-
51
-
52
-
53
-
54
-
55
-
56
-
57
-
58
-
59
-
60
-
61
-
62
-
63
-
64
-
65
-
66
-
67
-
68
-
69
-
70
-
71
-
72
-
73
-
74
-
75
-
76
-
77
-
78
-
79
-
80
-
81
-
82
-
83
-
84
-
85
-
86
-
87
-
88
-
89
-
90
-
91
-
92
-
93
-
94
-
95
-
96
-
97
-
98
-
99
-
100
-
101
-
102
-
103
-
104
-
105
-
106
-
107
-
108
-
 109
109 -
 110
110 -
 111
111 -
 112
112 -
 113
113 -
 114
114 -
 115
115 -
 116
116 -
 117
117 -
 118
118 -
 119
119 -
 120
120 -
 121
121 -
 122
122 -
 123
123 -
 124
124 -
 125
125 -
 126
126 -
 127
127 -
 128
128 -
 129
129 -
130
-
131
-
132
-
133
-
134
-
135
-
136
-
137
-
138
-
139
-
140
-
141
-
142
-
143
-
144
-
145
-
146
-
147
-
148
-
149
-
150
-
151
-
152
-
153
-
154
-
155
-
156
-
157
-
158
-
159
-
160
-
161
-
162
-
163
-
164
-
165
-
166
-
167
-
168
-
169
-
170
-
171
-
172
-
173
-
174
-
175
-
176
-
177
-
178
-
179
-
180
-
181
-
182
-
183
-
184
-
185
-
186
-
187
-
188
-
189
-
190
-
191
-
192
-
193
-
194
-
195
-
196
-
197
-
198
-
199
-
200
-
201
-
202
-
203
-
204
-
205
-
206
-
207
-
208
-
209
-
210
-
211
-
212
-
213
-
214
-
215
-
216
-
217
-
218
-
219
-
220
-
221
-
222
-
223
-
224
-
225
-
226
-
227
-
228
-
229
-
230
-
231
-
232
-
233
-
234
-
235
-
236
-
237
-
238
-
239
-
240
-
241
-
242
-
243
-
244
-
245
-
246
-
247
-
248
-
249
 |
 |

Table of Contents
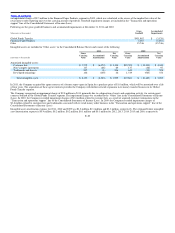
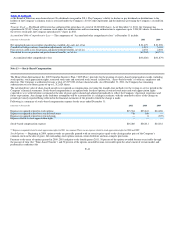
The estimated net loss and prior service cost for the defined benefit pension plan and SERPs that will be amortized from “Accumulated other
comprehensive loss” into “Net periodic benefit expense” during 2012 is $5.9 million ($3.6 million net of tax) and less than $0.1 million, respectively. The
estimated net loss and prior service credit for the postretirement benefit plans that will be amortized from “Accumulated other comprehensive loss” into
“Net periodic benefit expense” during 2011 is $0.4 million ($0.2 million, net of tax) and $0.6 million ($0.4 million net of tax), respectively.
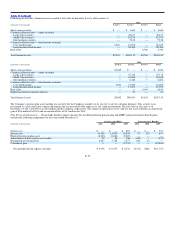
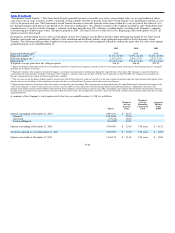
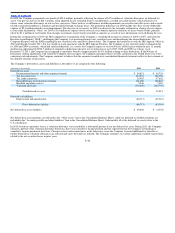
The benefit obligation and plan assets, changes to the benefit obligation and plan assets, and the funded status of the defined benefit pension plan and
SERPs and the postretirement benefit plans as of and for the year ended December 31 are as follows:
Pension and SERPs Postretirement Benefits
(Amounts in thousands) 2011 2010 2011 2010
Change in benefit obligation:
Benefit obligation at the beginning of the year $221,491 $211,616 $1,027 $ 4,521
Interest cost 11,365 11,876 51 253
Actuarial loss 3,444 11,417 1,790 1,100
Plan amendments — — — (4,154)
Medicare Part D reimbursements — — 27 32
Benefits paid (12,701) (13,418) (860) (725)
Benefit obligation at the end of the year $223,599 $221,491 $2,035 $ 1,027
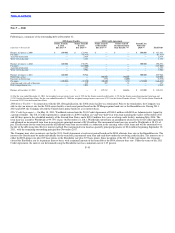
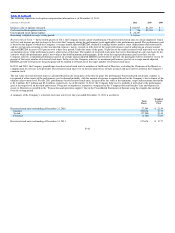
Pension and SERPs Postretirement Benefits
(Amounts in thousands) 2011 2010 2011 2010
Change in plan assets:
Fair value of plan assets at the beginning of the year $ 107,136 $ 102,908 $ — $ —
Actual return on plan assets 4,042 9,931 — —
Employer contributions 11,665 7,715 860 725
Benefits paid (12,701) (13,418) (860) (725)
Fair value of plan assets at the end of the year $ 110,142 $ 107,136 $ — $ —
Unfunded status at the end of the year $(113,457) $(114,355) $(2,035) $(1,027)
The unfunded status of the Pension and SERPs decreased by less than one percent as the benefit obligation increased $2.1 million and the fair value of the
pension plan assets increased $3.0 million during the year. The unfunded status of the defined benefit pension plan was $50.6 million and $45.8 million at
December 31, 2011 and 2010, respectively, and the unfunded status of the SERPs was $62.8 million and $68.6 million at December 31, 2011 and 2010,
respectively.
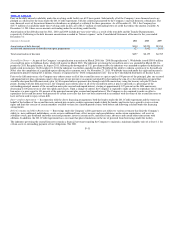
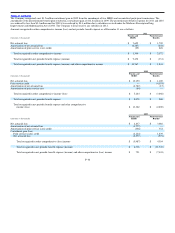
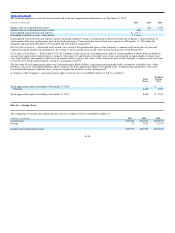
Following are the components recognized in the Consolidated Balance Sheets relating to the defined benefit pension plan and SERPs and the postretirement
benefit plans at December 31:
Pension and SERPs Postretirement Benefits
(Amounts in thousands) 2011 2010 2011 2010
Components recognized in the Consolidated Balance Sheets:
Pension and other postretirement benefits liability $(113,457) $(114,355) $(2,035) $(1,027)
Accumulated other comprehensive loss:
Unrealized losses for pension and postretirement
benefits, net of tax 60,536 59,706 2,026 1,067
Prior service cost (credit) for pension and postretirement
benefits, net of tax 153 171 (2,187) (2,575)
F−37