MoneyGram 2011 Annual Report Download - page 127
Download and view the complete annual report
Please find page 127 of the 2011 MoneyGram annual report below. You can navigate through the pages in the report by either clicking on the pages listed below, or by using the keyword search tool below to find specific information within the annual report.-
 1
1 -
2
-
3
-
4
-
5
-
6
-
7
-
8
-
9
-
10
-
11
-
12
-
13
-
14
-
15
-
16
-
17
-
18
-
19
-
20
-
21
-
22
-
23
-
24
-
25
-
26
-
27
-
28
-
29
-
30
-
31
-
32
-
33
-
34
-
35
-
36
-
37
-
38
-
39
-
40
-
41
-
42
-
43
-
44
-
45
-
46
-
47
-
48
-
49
-
50
-
51
-
52
-
53
-
54
-
55
-
56
-
57
-
58
-
59
-
60
-
61
-
62
-
63
-
64
-
65
-
66
-
67
-
68
-
69
-
70
-
71
-
72
-
73
-
74
-
75
-
76
-
77
-
78
-
79
-
80
-
81
-
82
-
83
-
84
-
85
-
86
-
87
-
88
-
89
-
90
-
91
-
92
-
93
-
94
-
95
-
96
-
97
-
98
-
99
-
100
-
101
-
102
-
103
-
104
-
105
-
106
-
107
-
108
-
109
-
110
-
111
-
112
-
113
-
114
-
115
-
116
-
 117
117 -
 118
118 -
 119
119 -
 120
120 -
 121
121 -
 122
122 -
 123
123 -
 124
124 -
 125
125 -
 126
126 -
 127
127 -
 128
128 -
 129
129 -
 130
130 -
 131
131 -
 132
132 -
 133
133 -
 134
134 -
 135
135 -
 136
136 -
 137
137 -
138
-
139
-
140
-
141
-
142
-
143
-
144
-
145
-
146
-
147
-
148
-
149
-
150
-
151
-
152
-
153
-
154
-
155
-
156
-
157
-
158
-
159
-
160
-
161
-
162
-
163
-
164
-
165
-
166
-
167
-
168
-
169
-
170
-
171
-
172
-
173
-
174
-
175
-
176
-
177
-
178
-
179
-
180
-
181
-
182
-
183
-
184
-
185
-
186
-
187
-
188
-
189
-
190
-
191
-
192
-
193
-
194
-
195
-
196
-
197
-
198
-
199
-
200
-
201
-
202
-
203
-
204
-
205
-
206
-
207
-
208
-
209
-
210
-
211
-
212
-
213
-
214
-
215
-
216
-
217
-
218
-
219
-
220
-
221
-
222
-
223
-
224
-
225
-
226
-
227
-
228
-
229
-
230
-
231
-
232
-
233
-
234
-
235
-
236
-
237
-
238
-
239
-
240
-
241
-
242
-
243
-
244
-
245
-
246
-
247
-
248
-
249
 |
 |
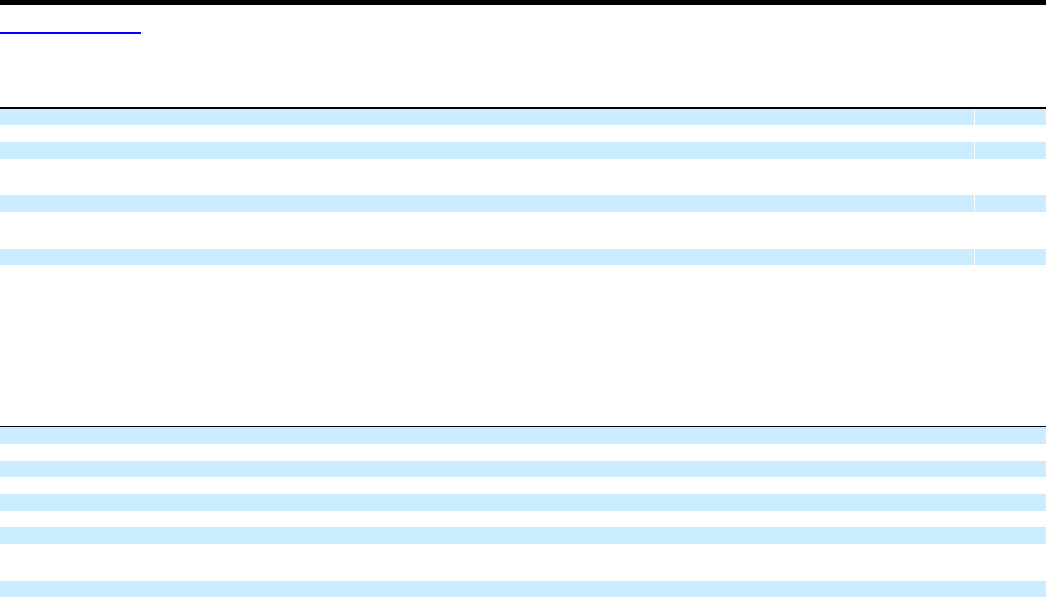
Table of Contents
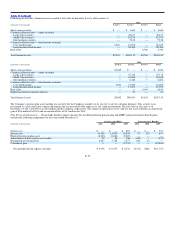
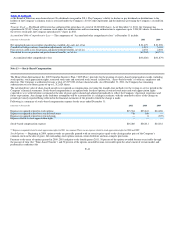
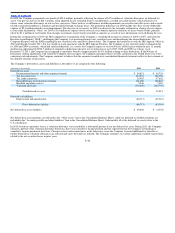
Foreign income consists of statutory income and losses from the Company’s international subsidiaries. Most of the Company’s wholly owned subsidiaries
recognize revenue based solely on services agreements with the primary United States operating subsidiary. Income tax (benefit) expense is as follows for
the year ended December 31:
(Amounts in thousands) 2011 2010 2009
Current income tax expense (benefit):
Federal $ 39,961 $ (757) $ (8,172)
State 6,293 147 669
Foreign 6,913 5,166 2,002
Current income tax expense (benefit) 53,167 4,556 (5,501)
Deferred income tax (benefit) expense (72,803) 10,023 (14,915)
Income tax (benefit) expense $(19,636) $14,579 $(20,416)
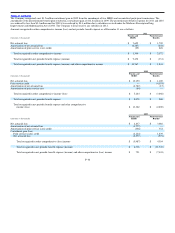
As of December 31, 2011 and 2010, the Company had a net income tax payable of $51.5 million and $6.3 million, respectively, recorded in the “Accounts
payable and other liabilities” line in the Consolidated Balance Sheets and a net income tax receivable of $1.6 million and $1.3 million, respectively,
recorded in the “Other assets” line in the Consolidated Balance Sheets, respectively. Income taxes paid were $3.7 million, $3.9 million and $2.2 million for
2011, 2010 and 2009, respectively. The Company received $3.8 million and $43.5 million federal income tax refunds in 2010 and 2009, respectively.
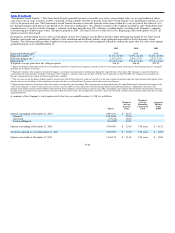
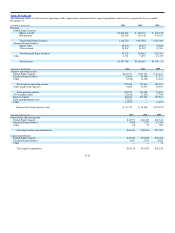
A reconciliation of the expected federal income tax at statutory rates for year ended to the actual taxes provided is as follows:
(Amounts in thousands) 2011 2010 2009
Income tax at statutory federal income tax rate $ 13,920 $ 20,433 $ (7,813)
Tax effect of:
State income tax, net of federal income tax effect 1,897 1,309 2,051
Valuation allowance (31,442) (10,016) (16,090)
International taxes 1,338 1,405 1,249
Net permanent differences (5,995) 51 3,092
Decrease in tax reserve (230) (377) (2,469)
Other 876 1,774 (436)
Income tax (benefit) expense $(19,636) $ 14,579 $(20,416)
In 2011, the Company recognized a tax benefit of $19.6 million, reflecting benefits of $34.0 million for the reversal of a portion of the valuation allowance
on domestic deferred tax assets, partially offset by an increase in the valuation allowance on a portion of deferred tax assets as a result of losses in certain
jurisdictions outside of the United States. The effective tax rate for 2011 reflects the expected utilization of net operating loss carry−forwards based on the
Company’s review of current facts and circumstances, including the three year cumulative income position and expectations that the Company will maintain
a cumulative income tax position in the future. Changes in facts and circumstances may cause the Company to record additional tax expense or benefits in
the future. Net permanent differences in 2011 include a benefit of $9.7 million from the sale of assets, partially offset by the effect of non−deductible capital
transaction costs and restructuring expenses of $2.1 million and $0.9 million, respectively.
In 2010, the Company had tax expense of $14.6 million, including the release of $11.9 million of valuation allowances on deferred tax assets in the
U.S. jurisdiction. The decrease in the tax reserve in 2010 was driven by the favorable settlement or closing of years subject to state audit. “Other” for 2010
includes a change in the tax treatment of the Medicare subsidy under the 2010 federal healthcare legislation and adjustments to the deferred taxes on fixed
assets.
F−45