MoneyGram 2011 Annual Report Download - page 47
Download and view the complete annual report
Please find page 47 of the 2011 MoneyGram annual report below. You can navigate through the pages in the report by either clicking on the pages listed below, or by using the keyword search tool below to find specific information within the annual report.-
 1
1 -
2
-
3
-
4
-
5
-
6
-
7
-
8
-
9
-
10
-
11
-
12
-
13
-
14
-
15
-
16
-
17
-
18
-
19
-
20
-
21
-
22
-
23
-
24
-
25
-
26
-
27
-
28
-
29
-
30
-
31
-
32
-
33
-
34
-
35
-
36
-
 37
37 -
 38
38 -
 39
39 -
 40
40 -
 41
41 -
 42
42 -
 43
43 -
 44
44 -
 45
45 -
 46
46 -
 47
47 -
 48
48 -
 49
49 -
 50
50 -
 51
51 -
 52
52 -
 53
53 -
 54
54 -
 55
55 -
 56
56 -
 57
57 -
58
-
59
-
60
-
61
-
62
-
63
-
64
-
65
-
66
-
67
-
68
-
69
-
70
-
71
-
72
-
73
-
74
-
75
-
76
-
77
-
78
-
79
-
80
-
81
-
82
-
83
-
84
-
85
-
86
-
87
-
88
-
89
-
90
-
91
-
92
-
93
-
94
-
95
-
96
-
97
-
98
-
99
-
100
-
101
-
102
-
103
-
104
-
105
-
106
-
107
-
108
-
109
-
110
-
111
-
112
-
113
-
114
-
115
-
116
-
117
-
118
-
119
-
120
-
121
-
122
-
123
-
124
-
125
-
126
-
127
-
128
-
129
-
130
-
131
-
132
-
133
-
134
-
135
-
136
-
137
-
138
-
139
-
140
-
141
-
142
-
143
-
144
-
145
-
146
-
147
-
148
-
149
-
150
-
151
-
152
-
153
-
154
-
155
-
156
-
157
-
158
-
159
-
160
-
161
-
162
-
163
-
164
-
165
-
166
-
167
-
168
-
169
-
170
-
171
-
172
-
173
-
174
-
175
-
176
-
177
-
178
-
179
-
180
-
181
-
182
-
183
-
184
-
185
-
186
-
187
-
188
-
189
-
190
-
191
-
192
-
193
-
194
-
195
-
196
-
197
-
198
-
199
-
200
-
201
-
202
-
203
-
204
-
205
-
206
-
207
-
208
-
209
-
210
-
211
-
212
-
213
-
214
-
215
-
216
-
217
-
218
-
219
-
220
-
221
-
222
-
223
-
224
-
225
-
226
-
227
-
228
-
229
-
230
-
231
-
232
-
233
-
234
-
235
-
236
-
237
-
238
-
239
-
240
-
241
-
242
-
243
-
244
-
245
-
246
-
247
-
248
-
249
 |
 |

Table of Contents
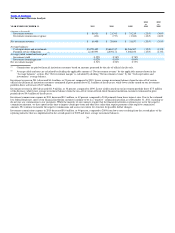
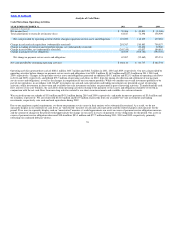
transfer transaction, higher signing bonus expense and higher marketing and compensation expense, partially offset by money transfer revenue growth net
of related commissions expense. Included in the 2010 operating margin is a $16.4 million benefit from a legal accrual reversal in 2010 related to a Global
Funds Transfer patent, which added a 155 basis point benefit to the 2010 operating margin.
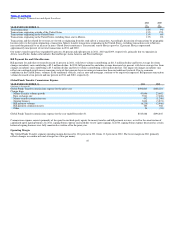
The operating margin for the Global Funds Transfer segment increased to 13.2 percent in 2010 from 8.1 percent in 2009. Included in the 2010 operating
margin is a $16.4 million benefit from a legal accrual reversal in 2010, which added a 155 basis point benefit to the 2010 operating margin. In 2009, the
operating margin included $34.5 million of legal reserves related to a patent lawsuit and a settlement agreement with the Federal Trade Commission, an
incremental $15.0 million provision for loss in 2009 from the closure of an international agent and a $3.2 million goodwill impairment charge related to a
discontinued bill payment product. After considering these items, the 2010 operating margin benefited from money transfer volume growth and lower
signing bonus amortization, partially offset by lower bill payment revenue.
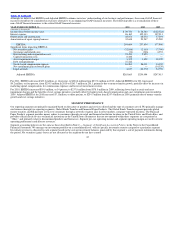
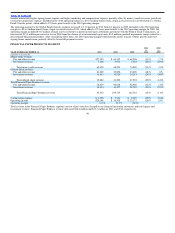
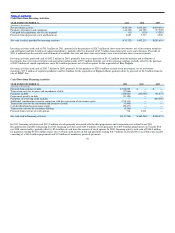
FINANCIAL PAPER PRODUCTS SEGMENT
2011 2010
vs. vs.
YEAR ENDED DECEMBER 31, 2011 2010 2009 2010 2009
(Amounts in thousands)
Money order revenue:
Fee and other revenue $57,350 $ 64,342 $ 69,296 (11)% (7)%
Investment revenue 3,100 3,951 5,584 (22)% (29)%
Total money order revenue 60,450 68,293 74,880 (11)% (9)%
Official check revenue:
Fee and other revenue 21,069 25,696 23,690 (18)% 8%
Investment revenue 11,813 15,526 24,213 (24)% (36)%
Total official check revenue 32,882 41,222 47,903 (20)% (14)%
Total Financial Paper Products revenue:
Fee and other revenue 78,419 90,038 92,986 (13)% (3)%
Investment revenue 14,913 19,477 29,797 (23)% (35)%
Total Financial Paper Products revenue 93,332 109,515 122,783 (15)% (11)%
Commissions expense $ 2,396 $ 3,931 $ 8,295 (39)% (53)%
Operating income $29,168 $ 36,508 $ 27,372 (20)% 33%
Operating margin 31.3% 33.3% 22.3%
Total revenue in the Financial Paper Products segment consists of per−item fees charged to our financial institution customers and retail agents and
investment revenue. Financial Paper Products revenue decreased $16.2 million and $13.3 million in 2011 and 2010, respectively.
46