MoneyGram 2011 Annual Report Download - page 30
Download and view the complete annual report
Please find page 30 of the 2011 MoneyGram annual report below. You can navigate through the pages in the report by either clicking on the pages listed below, or by using the keyword search tool below to find specific information within the annual report.-
 1
1 -
2
-
3
-
4
-
5
-
6
-
7
-
8
-
9
-
10
-
11
-
12
-
13
-
14
-
15
-
16
-
17
-
18
-
19
-
 20
20 -
 21
21 -
 22
22 -
 23
23 -
 24
24 -
 25
25 -
 26
26 -
 27
27 -
 28
28 -
 29
29 -
 30
30 -
 31
31 -
 32
32 -
 33
33 -
 34
34 -
 35
35 -
 36
36 -
 37
37 -
 38
38 -
 39
39 -
 40
40 -
41
-
42
-
43
-
44
-
45
-
46
-
47
-
48
-
49
-
50
-
51
-
52
-
53
-
54
-
55
-
56
-
57
-
58
-
59
-
60
-
61
-
62
-
63
-
64
-
65
-
66
-
67
-
68
-
69
-
70
-
71
-
72
-
73
-
74
-
75
-
76
-
77
-
78
-
79
-
80
-
81
-
82
-
83
-
84
-
85
-
86
-
87
-
88
-
89
-
90
-
91
-
92
-
93
-
94
-
95
-
96
-
97
-
98
-
99
-
100
-
101
-
102
-
103
-
104
-
105
-
106
-
107
-
108
-
109
-
110
-
111
-
112
-
113
-
114
-
115
-
116
-
117
-
118
-
119
-
120
-
121
-
122
-
123
-
124
-
125
-
126
-
127
-
128
-
129
-
130
-
131
-
132
-
133
-
134
-
135
-
136
-
137
-
138
-
139
-
140
-
141
-
142
-
143
-
144
-
145
-
146
-
147
-
148
-
149
-
150
-
151
-
152
-
153
-
154
-
155
-
156
-
157
-
158
-
159
-
160
-
161
-
162
-
163
-
164
-
165
-
166
-
167
-
168
-
169
-
170
-
171
-
172
-
173
-
174
-
175
-
176
-
177
-
178
-
179
-
180
-
181
-
182
-
183
-
184
-
185
-
186
-
187
-
188
-
189
-
190
-
191
-
192
-
193
-
194
-
195
-
196
-
197
-
198
-
199
-
200
-
201
-
202
-
203
-
204
-
205
-
206
-
207
-
208
-
209
-
210
-
211
-
212
-
213
-
214
-
215
-
216
-
217
-
218
-
219
-
220
-
221
-
222
-
223
-
224
-
225
-
226
-
227
-
228
-
229
-
230
-
231
-
232
-
233
-
234
-
235
-
236
-
237
-
238
-
239
-
240
-
241
-
242
-
243
-
244
-
245
-
246
-
247
-
248
-
249
 |
 |

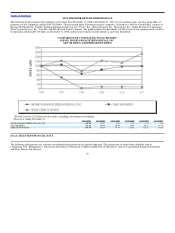
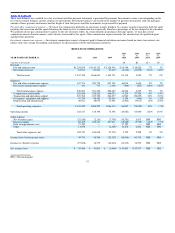
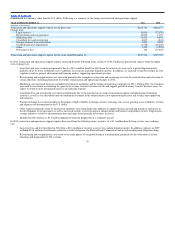
Table of Contents STOCKHOLDER RETURN PERFORMANCE
The following graph compares the cumulative total return from December 31, 2006 to December 31, 2011 for our common stock, our peer group index of
payment services companies and the S&P 500 Index. The peer group index of payment services companies, referred to as the Peer Group Index, consists of:
Euronet Worldwide Inc., Fidelity National Information Services, Inc., Fiserv, Inc., Global Payments Inc., MasterCard, Inc., Online Resources Corporation,
Total System Services, Inc., Visa, Inc. and The Western Union Company. The graph assumes the investment of $100 in each of our common stock, our Peer
Group Index and the S&P 500 Index on December 31, 2006, and the reinvestment of all dividends as and when distributed.
COMPARISON OF CUMULATIVE TOTAL RETURN*
AMONG MONEYGRAM INTERNATIONAL, INC.,
S&P 500 INDEX AND PEER GROUP INDEX
*$100 invested on 12/31/06 in stock or index, including reinvestment of dividends.
Fiscal year ending December 31. 12/31/2006 12/31/2007 12/31/2008 12/31/2009 12/31/2010 12/31/2011
MONEYGRAM INTERNATIONAL, INC. 100.00 49.47 3.28 9.27 8.72 7.14
S&P 500 INDEX 100.00 105.49 66.46 84.05 96.71 98.75
PEER GROUP INDEX 100.00 124.59 78.48 124.26 113.57 153.63
Item 6. SELECTED FINANCIAL DATA
The following table presents our selected consolidated financial data for the periods indicated. The information set forth below should be read in
conjunction with “Management’s Discussion and Analysis of Financial Condition and Results of Operations” and our Consolidated Financial Statements
and Notes thereto. For the basis
29