MoneyGram 2011 Annual Report Download - page 43
Download and view the complete annual report
Please find page 43 of the 2011 MoneyGram annual report below. You can navigate through the pages in the report by either clicking on the pages listed below, or by using the keyword search tool below to find specific information within the annual report.-
 1
1 -
2
-
3
-
4
-
5
-
6
-
7
-
8
-
9
-
10
-
11
-
12
-
13
-
14
-
15
-
16
-
17
-
18
-
19
-
20
-
21
-
22
-
23
-
24
-
25
-
26
-
27
-
28
-
29
-
30
-
31
-
32
-
 33
33 -
 34
34 -
 35
35 -
 36
36 -
 37
37 -
 38
38 -
 39
39 -
 40
40 -
 41
41 -
 42
42 -
 43
43 -
 44
44 -
 45
45 -
 46
46 -
 47
47 -
 48
48 -
 49
49 -
 50
50 -
 51
51 -
 52
52 -
 53
53 -
54
-
55
-
56
-
57
-
58
-
59
-
60
-
61
-
62
-
63
-
64
-
65
-
66
-
67
-
68
-
69
-
70
-
71
-
72
-
73
-
74
-
75
-
76
-
77
-
78
-
79
-
80
-
81
-
82
-
83
-
84
-
85
-
86
-
87
-
88
-
89
-
90
-
91
-
92
-
93
-
94
-
95
-
96
-
97
-
98
-
99
-
100
-
101
-
102
-
103
-
104
-
105
-
106
-
107
-
108
-
109
-
110
-
111
-
112
-
113
-
114
-
115
-
116
-
117
-
118
-
119
-
120
-
121
-
122
-
123
-
124
-
125
-
126
-
127
-
128
-
129
-
130
-
131
-
132
-
133
-
134
-
135
-
136
-
137
-
138
-
139
-
140
-
141
-
142
-
143
-
144
-
145
-
146
-
147
-
148
-
149
-
150
-
151
-
152
-
153
-
154
-
155
-
156
-
157
-
158
-
159
-
160
-
161
-
162
-
163
-
164
-
165
-
166
-
167
-
168
-
169
-
170
-
171
-
172
-
173
-
174
-
175
-
176
-
177
-
178
-
179
-
180
-
181
-
182
-
183
-
184
-
185
-
186
-
187
-
188
-
189
-
190
-
191
-
192
-
193
-
194
-
195
-
196
-
197
-
198
-
199
-
200
-
201
-
202
-
203
-
204
-
205
-
206
-
207
-
208
-
209
-
210
-
211
-
212
-
213
-
214
-
215
-
216
-
217
-
218
-
219
-
220
-
221
-
222
-
223
-
224
-
225
-
226
-
227
-
228
-
229
-
230
-
231
-
232
-
233
-
234
-
235
-
236
-
237
-
238
-
239
-
240
-
241
-
242
-
243
-
244
-
245
-
246
-
247
-
248
-
249
 |
 |

Table of Contents
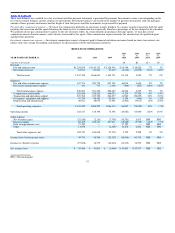
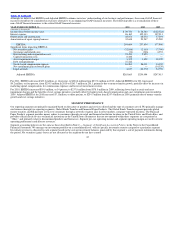
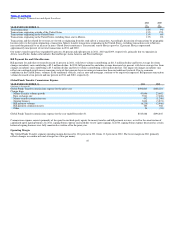
Although we believe that EBITDA and Adjusted EBITDA enhance investors’ understanding of our business and performance, these non−GAAP financial
measures should not be considered an exclusive alternative to accompanying GAAP financial measures. The following table is a reconciliation of these
non−GAAP financial measures to the related GAAP financial measures.
YEAR ENDED DECEMBER 31, 2011 2010 2009
(Amounts in thousands)
Income (loss) before income taxes $ 39,770 $ 58,380 $ (22,322)
Interest expense 86,165 102,133 107,911
Depreciation and amortization 46,051 48,074 57,091
Amortization of agent signing bonuses 32,618 29,247 35,280
EBITDA 204,604 237,834 177,960
Significant items impacting EBITDA:
Net securities gains (32,816) (2,115) (7,790)
Severance and related costs (31) (346) 4,353
Restructuring and reorganization costs 23,470 5,853 —
Capital transaction costs 6,446 — —
Asset impairment charges 3,372 1,829 18,329
Debt extinguishment 37,522
Stock−based compensation expense 16,281 26,011 14,152
Net curtailment gain on benefit plans — — (14,339)
Legal accruals 4,817 (14,572) 54,750
Adjusted EBITDA $263,665 $254,494 $247,415
For 2011, EBITDA decreased $33.2 million, or 14 percent, to $204.6 million from $237.8 million in 2010. Adjusted EBITDA for 2011 increased
$9.2 million, or four percent, from $254.5 million in 2010 to $263.7 million in 2011, primarily due to money transfer growth, partially offset by increases in
marketing spend, compensation, fee commissions expenses and lower net investment revenue.
For 2010, EBITDA increased $59.9 million, or 34 percent, to $237.8 million from $178.0 million in 2009, reflecting lower legal accruals and asset
impairment charges and the benefits of cost savings initiatives, partially offset by higher stock−based compensation and a net curtailment gain recorded in
2009. Adjusted EBITDA for 2010 increased $7.1 million, or three percent, to $254.5 million from $247.4 million in 2009, primarily due to money transfer
growth and cost savings initiatives.
SEGMENT PERFORMANCE
Our reporting segments are primarily organized based on the nature of products and services offered and the type of consumer served. We primarily manage
our business through two reporting segments, Global Funds Transfer and Financial Paper Products. The Global Funds Transfer segment provides global
money transfers and bill payment services to consumers through a network of agents and, in select markets, company−operated locations. The Financial
Paper Products segment provides money orders to consumers through our retail and financial institution locations in the United States and Puerto Rico, and
provides official check services to financial institutions in the United States. Businesses that are not operated within these segments are categorized as
“Other,” and primarily relate to discontinued products and businesses. Segment pre−tax operating income and segment operating margin are used to review
operating performance and allocate resources.
Segment accounting policies are the same as those described in Note 2 — Summary of Significant Accounting Policies in the Notes to the Consolidated
Financial Statements. We manage our investment portfolio on a consolidated level, with no specific investment security assigned to a particular segment.
Investment revenue is allocated to each segment based on the average investment balances generated by that segment’s sale of payment instruments during
the period. Net securities (gains) losses are not allocated as the segments do not have control
42