MoneyGram 2011 Annual Report Download - page 142
Download and view the complete annual report
Please find page 142 of the 2011 MoneyGram annual report below. You can navigate through the pages in the report by either clicking on the pages listed below, or by using the keyword search tool below to find specific information within the annual report.-
 1
1 -
2
-
3
-
4
-
5
-
6
-
7
-
8
-
9
-
10
-
11
-
12
-
13
-
14
-
15
-
16
-
17
-
18
-
19
-
20
-
21
-
22
-
23
-
24
-
25
-
26
-
27
-
28
-
29
-
30
-
31
-
32
-
33
-
34
-
35
-
36
-
37
-
38
-
39
-
40
-
41
-
42
-
43
-
44
-
45
-
46
-
47
-
48
-
49
-
50
-
51
-
52
-
53
-
54
-
55
-
56
-
57
-
58
-
59
-
60
-
61
-
62
-
63
-
64
-
65
-
66
-
67
-
68
-
69
-
70
-
71
-
72
-
73
-
74
-
75
-
76
-
77
-
78
-
79
-
80
-
81
-
82
-
83
-
84
-
85
-
86
-
87
-
88
-
89
-
90
-
91
-
92
-
93
-
94
-
95
-
96
-
97
-
98
-
99
-
100
-
101
-
102
-
103
-
104
-
105
-
106
-
107
-
108
-
109
-
110
-
111
-
112
-
113
-
114
-
115
-
116
-
117
-
118
-
119
-
120
-
121
-
122
-
123
-
124
-
125
-
126
-
127
-
128
-
129
-
130
-
131
-
 132
132 -
 133
133 -
 134
134 -
 135
135 -
 136
136 -
 137
137 -
 138
138 -
 139
139 -
 140
140 -
 141
141 -
 142
142 -
 143
143 -
 144
144 -
 145
145 -
 146
146 -
 147
147 -
 148
148 -
 149
149 -
 150
150 -
 151
151 -
 152
152 -
153
-
154
-
155
-
156
-
157
-
158
-
159
-
160
-
161
-
162
-
163
-
164
-
165
-
166
-
167
-
168
-
169
-
170
-
171
-
172
-
173
-
174
-
175
-
176
-
177
-
178
-
179
-
180
-
181
-
182
-
183
-
184
-
185
-
186
-
187
-
188
-
189
-
190
-
191
-
192
-
193
-
194
-
195
-
196
-
197
-
198
-
199
-
200
-
201
-
202
-
203
-
204
-
205
-
206
-
207
-
208
-
209
-
210
-
211
-
212
-
213
-
214
-
215
-
216
-
217
-
218
-
219
-
220
-
221
-
222
-
223
-
224
-
225
-
226
-
227
-
228
-
229
-
230
-
231
-
232
-
233
-
234
-
235
-
236
-
237
-
238
-
239
-
240
-
241
-
242
-
243
-
244
-
245
-
246
-
247
-
248
-
249
 |
 |
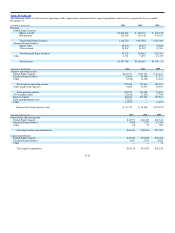
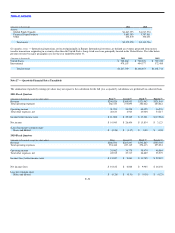
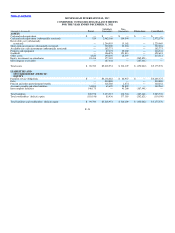
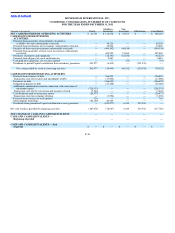
Table of Contents MONEYGRAM INTERNATIONAL, INC.
CONDENSED, CONSOLIDATING STATEMENTS OF (LOSS) INCOME
FOR THE YEAR ENDED DECEMBER 31, 2009
Subsidiary Non−
(Amounts in thousands) Parent Guarantors Guarantors Eliminations Consolidated
REVENUE
Fee and other revenue $ — $1,123,375 $ 126,810 $ (121,693) $ 1,128,492
Investment revenue — 31,208 2,011 — 33,219
Total revenue — 1,154,583 128,821 (121,693) 1,161,711
EXPENSES
Fee and other commissions expense — 514,142 21,573 (38,610) 497,105
Investment commissions expense — 1,362 — — 1,362
Total commissions expense — 515,504 21,573 (38,610) 498,467
Compensation and benefits 3,942 155,008 40,103 — 199,053
Transaction and operations support 42,878 267,375 57,107 (83,083) 284,277
Occupancy, equipment and supplies — 37,999 9,426 — 47,425
Depreciation and amortization — 44,979 12,112 — 57,091
Total operating expenses 46,820 1,020,865 140,321 (121,693) 1,086,313
OPERATING (LOSS) INCOME (46,820) 133,718 (11,500) — 75,398
Other expense (income)
Net securities (gains) losses — (7,790) — — (7,790)
Interest expense — 107,911 — — 107,911
Other — (2,401) — — (2,401)
Total other expenses, net — 97,720 — — 97,720
(Loss) income before income taxes (46,820) 35,998 (11,500) — (22,322)
Income tax (benefit) expense (16,387) (6,010) 1,981 — (20,416)
(Loss) income after income taxes (30,433) 42,008 (13,481) — (1,906)
Equity income (loss) in subsidiaries 28,527 (13,481) — (15,046) —
NET (LOSS) INCOME $ (1,906) $ 28,527 $ (13,481) $ (15,046) $ (1,906)
F−60