MoneyGram 2011 Annual Report Download - page 108
Download and view the complete annual report
Please find page 108 of the 2011 MoneyGram annual report below. You can navigate through the pages in the report by either clicking on the pages listed below, or by using the keyword search tool below to find specific information within the annual report.-
 1
1 -
2
-
3
-
4
-
5
-
6
-
7
-
8
-
9
-
10
-
11
-
12
-
13
-
14
-
15
-
16
-
17
-
18
-
19
-
20
-
21
-
22
-
23
-
24
-
25
-
26
-
27
-
28
-
29
-
30
-
31
-
32
-
33
-
34
-
35
-
36
-
37
-
38
-
39
-
40
-
41
-
42
-
43
-
44
-
45
-
46
-
47
-
48
-
49
-
50
-
51
-
52
-
53
-
54
-
55
-
56
-
57
-
58
-
59
-
60
-
61
-
62
-
63
-
64
-
65
-
66
-
67
-
68
-
69
-
70
-
71
-
72
-
73
-
74
-
75
-
76
-
77
-
78
-
79
-
80
-
81
-
82
-
83
-
84
-
85
-
86
-
87
-
88
-
89
-
90
-
91
-
92
-
93
-
94
-
95
-
96
-
97
-
 98
98 -
 99
99 -
 100
100 -
 101
101 -
 102
102 -
 103
103 -
 104
104 -
 105
105 -
 106
106 -
 107
107 -
 108
108 -
 109
109 -
 110
110 -
 111
111 -
 112
112 -
 113
113 -
 114
114 -
 115
115 -
 116
116 -
 117
117 -
 118
118 -
119
-
120
-
121
-
122
-
123
-
124
-
125
-
126
-
127
-
128
-
129
-
130
-
131
-
132
-
133
-
134
-
135
-
136
-
137
-
138
-
139
-
140
-
141
-
142
-
143
-
144
-
145
-
146
-
147
-
148
-
149
-
150
-
151
-
152
-
153
-
154
-
155
-
156
-
157
-
158
-
159
-
160
-
161
-
162
-
163
-
164
-
165
-
166
-
167
-
168
-
169
-
170
-
171
-
172
-
173
-
174
-
175
-
176
-
177
-
178
-
179
-
180
-
181
-
182
-
183
-
184
-
185
-
186
-
187
-
188
-
189
-
190
-
191
-
192
-
193
-
194
-
195
-
196
-
197
-
198
-
199
-
200
-
201
-
202
-
203
-
204
-
205
-
206
-
207
-
208
-
209
-
210
-
211
-
212
-
213
-
214
-
215
-
216
-
217
-
218
-
219
-
220
-
221
-
222
-
223
-
224
-
225
-
226
-
227
-
228
-
229
-
230
-
231
-
232
-
233
-
234
-
235
-
236
-
237
-
238
-
239
-
240
-
241
-
242
-
243
-
244
-
245
-
246
-
247
-
248
-
249
 |
 |

Table of Contents
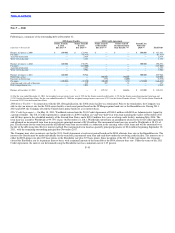
to a nominal fair value, resulting in a realized gain of $32.8 million in 2011 recorded in “Net securities gains” in the Consolidated Income Statements. The
Company’s final trading investment was called at par during 2010, resulting in a $2.4 million gain, net of the reversal of the related put options, recorded in
“Net securities gains”.
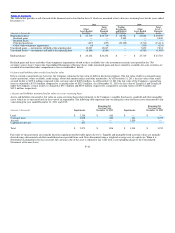
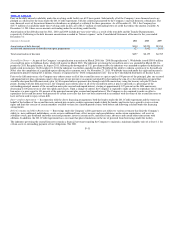
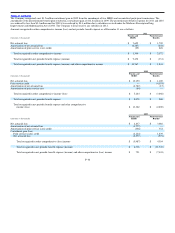
Investment Ratings — In rating the securities in its investment portfolio, the Company uses ratings from Moody’s Investor Service (“Moody’s”),
Standard & Poors (“S&P”) and Fitch Ratings (“Fitch”). If the rating agencies have split ratings, the Company uses the highest rating across the rating
agencies for disclosure purposes. Securities issued or backed by U.S. government agencies are included in the AAA rating category. Investment grade is
defined as a security having a Moody’s equivalent rating of Aaa, Aa, A or Baa or an S&P or Fitch equivalent rating of AAA, AA, A or BBB. The
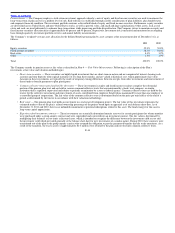
Company’s investments at December 31 consisted of the following ratings:
2011 2010
(Dollars in thousands) Number of
Securities Fair
Value Percent of
Investments Number of
Securities Fair
Value Percent of
Investments
AAA, including United States agencies 24 $ 78,267 76% 25 $136,893 85%
Below investment grade 60 24,504 24% 64 24,043 15%
Total 84 $102,771 100% 89 $160,936 100%
Had the Company used the lowest rating from the rating agencies in the information presented above, there would be less than a $0.1 million change to
investments rated A or better as of December 31, 2011 and no change at December 31, 2010.
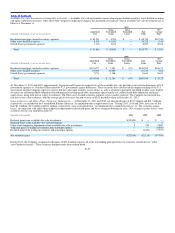
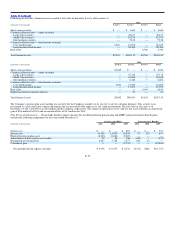
Contractual Maturities — The amortized cost and fair value of available−for−sale securities at December 31, by contractual maturity, are shown below.
Actual maturities may differ from contractual maturities as borrowers may have the right to call or prepay obligations, sometimes without call or
prepayment penalties. Maturities of mortgage−backed and other asset−backed securities depend on the repayment characteristics and experience of the
underlying obligations.
2011 2010
(Amounts in thousands) Amortized
Cost Fair
Value Amortized
Cost Fair
Value
After one year through five years $ 7,723 $ 8,827 $ 7,273 $ 8,641
Mortgage−backed and other asset−backed securities 74,162 93,944 132,367 152,295
Total $ 81,885 $102,771 $139,640 $160,936
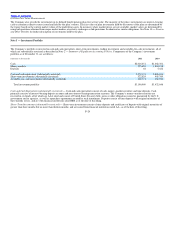
Fair Value Determination — The Company uses various sources of pricing for its fair value estimates of its available−for−sale portfolio. The percentage of
the portfolio for which the various pricing sources were used is as follows at December 31, 2011 and 2010: 69 percent and 81 percent, respectively, used a
third party pricing service; 13 percent and 6 percent, respectively, used broker pricing; and 18 percent and 13 percent, respectively, used internal pricing.
Assessment of Unrealized Losses — At December 31, 2011, the Company had no unrealized losses in its available−for−sale portfolio. As of December 31
2010, the Company had nominal unrealized losses in its available−for−sale portfolio, with one residential mortgage−backed agency security in an
unrealized loss position aged 12 months or more, after the recognition of other−than−temporary impairment charges.
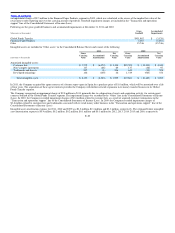
Note 6 — Derivative Financial Instruments
The Company uses forward contracts to manage its foreign currency needs and exchange risk arising from its assets and liabilities denominated in foreign
currencies. While these contracts mitigate certain foreign currency risk, they are not designated as hedges for accounting purposes. The “Transaction and
operations support” line in
F−26