MoneyGram 2011 Annual Report Download - page 126
Download and view the complete annual report
Please find page 126 of the 2011 MoneyGram annual report below. You can navigate through the pages in the report by either clicking on the pages listed below, or by using the keyword search tool below to find specific information within the annual report.-
 1
1 -
2
-
3
-
4
-
5
-
6
-
7
-
8
-
9
-
10
-
11
-
12
-
13
-
14
-
15
-
16
-
17
-
18
-
19
-
20
-
21
-
22
-
23
-
24
-
25
-
26
-
27
-
28
-
29
-
30
-
31
-
32
-
33
-
34
-
35
-
36
-
37
-
38
-
39
-
40
-
41
-
42
-
43
-
44
-
45
-
46
-
47
-
48
-
49
-
50
-
51
-
52
-
53
-
54
-
55
-
56
-
57
-
58
-
59
-
60
-
61
-
62
-
63
-
64
-
65
-
66
-
67
-
68
-
69
-
70
-
71
-
72
-
73
-
74
-
75
-
76
-
77
-
78
-
79
-
80
-
81
-
82
-
83
-
84
-
85
-
86
-
87
-
88
-
89
-
90
-
91
-
92
-
93
-
94
-
95
-
96
-
97
-
98
-
99
-
100
-
101
-
102
-
103
-
104
-
105
-
106
-
107
-
108
-
109
-
110
-
111
-
112
-
113
-
114
-
115
-
 116
116 -
 117
117 -
 118
118 -
 119
119 -
 120
120 -
 121
121 -
 122
122 -
 123
123 -
 124
124 -
 125
125 -
 126
126 -
 127
127 -
 128
128 -
 129
129 -
 130
130 -
 131
131 -
 132
132 -
 133
133 -
 134
134 -
 135
135 -
 136
136 -
137
-
138
-
139
-
140
-
141
-
142
-
143
-
144
-
145
-
146
-
147
-
148
-
149
-
150
-
151
-
152
-
153
-
154
-
155
-
156
-
157
-
158
-
159
-
160
-
161
-
162
-
163
-
164
-
165
-
166
-
167
-
168
-
169
-
170
-
171
-
172
-
173
-
174
-
175
-
176
-
177
-
178
-
179
-
180
-
181
-
182
-
183
-
184
-
185
-
186
-
187
-
188
-
189
-
190
-
191
-
192
-
193
-
194
-
195
-
196
-
197
-
198
-
199
-
200
-
201
-
202
-
203
-
204
-
205
-
206
-
207
-
208
-
209
-
210
-
211
-
212
-
213
-
214
-
215
-
216
-
217
-
218
-
219
-
220
-
221
-
222
-
223
-
224
-
225
-
226
-
227
-
228
-
229
-
230
-
231
-
232
-
233
-
234
-
235
-
236
-
237
-
238
-
239
-
240
-
241
-
242
-
243
-
244
-
245
-
246
-
247
-
248
-
249
 |
 |

Table of Contents
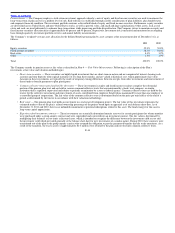
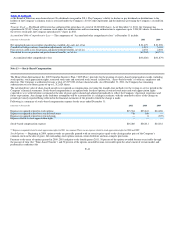
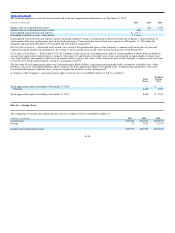
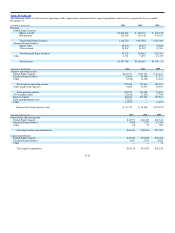
The following represents restricted stock and restricted stock unit compensation information as of December 31, 2011:
(Amounts in thousands) 2011 2010 2009
Market value of restricted stock vested — 283 1,550
Market value of restricted stock units vested 600 — —
Unrecognized restricted stock unit expense $ 2,377
Remaining weighted−average vesting period 2.7 years
Unrecognized restricted stock unit expense and the remaining weighted−average vesting period are presented under the Company’s current estimate of
achievement of the target performance goal on the third anniversary. Unrecognized restricted stock unit expense as of December 31, 2011 under the
minimum and maximum thresholds is $1.0 million and $4.4 million, respectively.
Restricted Stock Awards — Restricted stock awards were valued at the quoted market price of the Company’s common stock on the date of grant and
expensed using the straight−line method over the vesting or service period of the award. All restricted stock awards vested during 2010.
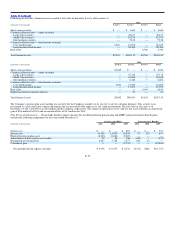
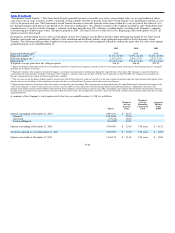
Stock Appreciation Rights — In November 2011, the Company issued a grant of stock appreciation rights to certain employees which entitle the holder to
any per share appreciation from the price at issuance. The grants vest and become exercisable over a four−year period in an equal number of shares each
year. Upon exercise, the employee will receive an amount which is equal to the excess of the closing sale price of the Company’s common stock at the time
of exercise over the grant price paid in cash up to a maximum of $12.00.
The fair value of stock appreciation rights was calculated using a Black−Scholes single option pricing model and is recorded as a liability in the “Other
liabilities” line in the Consolidated Balance Sheets. Expense for stock appreciation rights is recognized in the “Compensation and benefits” line in the
Consolidated Statements of Income (Loss) using the straight−line method over the vesting period.
A summary of the Company’s stock appreciation rights activity for the year ended December 31, 2011 is as follows:
Weighted
Total Average
Shares Price
Stock appreciation rights outstanding at December 31, 2010 — $ —
Granted 8,600 17.03
Stock appreciation rights outstanding at December 31, 2011 8,600 $ 17.03
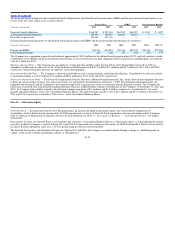
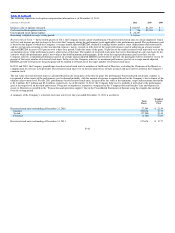
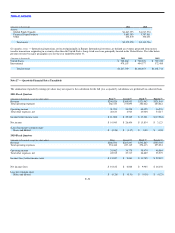
Note 14 — Income Taxes
The components of income (loss) before income taxes are as follows for the year ended December 31:
(Amounts in thousands) 2011 2010 2009
United States $39,749 $56,872 $(19,975)
Foreign 21 1,508 (2,347)
Income (loss) before income taxes $39,770 $58,380 $(22,322)
F−44