MoneyGram 2011 Annual Report Download - page 40
Download and view the complete annual report
Please find page 40 of the 2011 MoneyGram annual report below. You can navigate through the pages in the report by either clicking on the pages listed below, or by using the keyword search tool below to find specific information within the annual report.-
 1
1 -
2
-
3
-
4
-
5
-
6
-
7
-
8
-
9
-
10
-
11
-
12
-
13
-
14
-
15
-
16
-
17
-
18
-
19
-
20
-
21
-
22
-
23
-
24
-
25
-
26
-
27
-
28
-
29
-
 30
30 -
 31
31 -
 32
32 -
 33
33 -
 34
34 -
 35
35 -
 36
36 -
 37
37 -
 38
38 -
 39
39 -
 40
40 -
 41
41 -
 42
42 -
 43
43 -
 44
44 -
 45
45 -
 46
46 -
 47
47 -
 48
48 -
 49
49 -
 50
50 -
51
-
52
-
53
-
54
-
55
-
56
-
57
-
58
-
59
-
60
-
61
-
62
-
63
-
64
-
65
-
66
-
67
-
68
-
69
-
70
-
71
-
72
-
73
-
74
-
75
-
76
-
77
-
78
-
79
-
80
-
81
-
82
-
83
-
84
-
85
-
86
-
87
-
88
-
89
-
90
-
91
-
92
-
93
-
94
-
95
-
96
-
97
-
98
-
99
-
100
-
101
-
102
-
103
-
104
-
105
-
106
-
107
-
108
-
109
-
110
-
111
-
112
-
113
-
114
-
115
-
116
-
117
-
118
-
119
-
120
-
121
-
122
-
123
-
124
-
125
-
126
-
127
-
128
-
129
-
130
-
131
-
132
-
133
-
134
-
135
-
136
-
137
-
138
-
139
-
140
-
141
-
142
-
143
-
144
-
145
-
146
-
147
-
148
-
149
-
150
-
151
-
152
-
153
-
154
-
155
-
156
-
157
-
158
-
159
-
160
-
161
-
162
-
163
-
164
-
165
-
166
-
167
-
168
-
169
-
170
-
171
-
172
-
173
-
174
-
175
-
176
-
177
-
178
-
179
-
180
-
181
-
182
-
183
-
184
-
185
-
186
-
187
-
188
-
189
-
190
-
191
-
192
-
193
-
194
-
195
-
196
-
197
-
198
-
199
-
200
-
201
-
202
-
203
-
204
-
205
-
206
-
207
-
208
-
209
-
210
-
211
-
212
-
213
-
214
-
215
-
216
-
217
-
218
-
219
-
220
-
221
-
222
-
223
-
224
-
225
-
226
-
227
-
228
-
229
-
230
-
231
-
232
-
233
-
234
-
235
-
236
-
237
-
238
-
239
-
240
-
241
-
242
-
243
-
244
-
245
-
246
-
247
-
248
-
249
 |
 |

Table of Contents
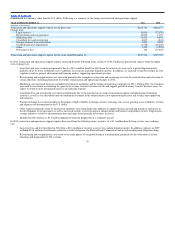
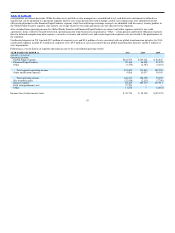
• Marketing costs increased to support transaction and agent growth.
• Foreign exchange losses increased due to the impact of high volatility in foreign currency exchange rates on our growing assets, liabilities, revenue
and expenses not denominated in the U.S. dollar.
• Other expenses decreased from targeted cost savings initiatives, particularly related to telecommunications and agent forms, partially offset by
costs related to the implementation of the European Union Payment Services Directive and international licensing requirements.
• Provision for loss increased primarily due to the closure of an international agent.
• Goodwill and asset impairments in 2009 related to the disposition of two businesses and a corporate aircraft, discontinuation of certain bill
payment product offerings and the Financial Paper Products segment.
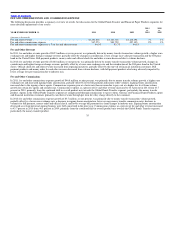
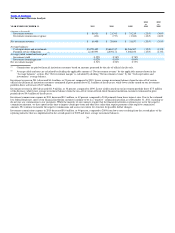
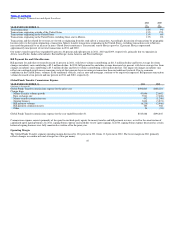
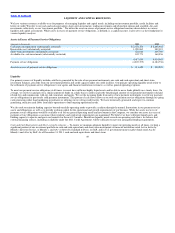
Occupancy, equipment and supplies — Occupancy, equipment and supplies expense includes facilities rent and maintenance costs, software and equipment
maintenance costs, freight and delivery costs and supplies. Expenses in 2011 increased $1.3 million, or three percent, compared to 2010 primarily due to
$1.0 million of restructuring costs relating to facility consolidation and relocation, partially offset by cost reductions due to our facilities rationalization
efforts. As reflected in the amounts discussed above, the increase in the euro exchange rate increased occupancy, equipment and supplies expense by
$0.6 million in 2011.
Expenses in 2010 decreased $0.9 million, or two percent, compared to 2009 due to lower delivery, postage and freight costs from controlled spending and
the timing of agent roll−outs, partially offset by $1.6 million of facility cease−use and related charges associated with restructuring activities. As reflected in
the amounts discussed above, the decrease in the euro exchange rate decreased occupancy, equipment and supplies expense by $0.6 million in 2010.
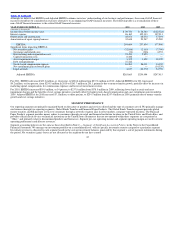
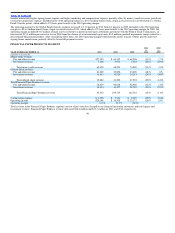
Depreciation and amortization — Depreciation and amortization expense includes depreciation on point of sale equipment, agent signage, computer
hardware and software, capitalized software development costs, office furniture, equipment and leasehold improvements and amortization of intangible
assets. Depreciation and amortization decreased $2.0 million, or four percent, in 2011 compared to 2010, primarily from lower depreciation expense on
point of sale equipment, computer hardware and other equipment, partially offset by an increase in amortization of capitalized software from the 2010
implementation of a new system that increased the flexibility of our back office and improved operating efficiencies. As reflected in the amounts discussed
above, the increase in the euro exchange rate increased depreciation and amortization expense by $0.5 million in 2011. In connection with our global
transformation initiative, we plan to make further investments in our infrastructure to enhance operating efficiencies and support our continued growth. As a
result of these investments, depreciation and amortization expense may increase in the future.
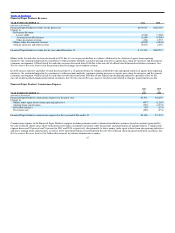
Depreciation and amortization decreased $9.0 million, or 16 percent, in 2010 compared to 2009, primarily from lower depreciation expense on point of sale
equipment, computer hardware and other equipment, signs and amortization of capitalized software. As reflected in the amounts discussed above, the
decrease in the euro exchange rate decreased depreciation and amortization expense by $0.5 million in 2010.
39