MoneyGram 2011 Annual Report Download - page 117
Download and view the complete annual report
Please find page 117 of the 2011 MoneyGram annual report below. You can navigate through the pages in the report by either clicking on the pages listed below, or by using the keyword search tool below to find specific information within the annual report.-
 1
1 -
 2
2 -
 3
3 -
 4
4 -
 5
5 -
 6
6 -
 7
7 -
 8
8 -
 9
9 -
 10
10 -
 11
11 -
 12
12 -
 13
13 -
 14
14 -
 15
15 -
 16
16 -
 17
17 -
 18
18 -
 19
19 -
 20
20 -
 21
21 -
 22
22 -
 23
23 -
 24
24 -
 25
25 -
 26
26 -
 27
27 -
 28
28 -
 29
29 -
 30
30 -
 31
31 -
 32
32 -
 33
33 -
 34
34 -
 35
35 -
 36
36 -
 37
37 -
 38
38 -
 39
39 -
 40
40 -
 41
41 -
 42
42 -
 43
43 -
 44
44 -
 45
45 -
 46
46 -
 47
47 -
 48
48 -
 49
49 -
 50
50 -
 51
51 -
 52
52 -
 53
53 -
 54
54 -
 55
55 -
 56
56 -
 57
57 -
 58
58 -
 59
59 -
 60
60 -
 61
61 -
 62
62 -
 63
63 -
 64
64 -
 65
65 -
 66
66 -
 67
67 -
 68
68 -
 69
69 -
 70
70 -
 71
71 -
 72
72 -
 73
73 -
 74
74 -
 75
75 -
 76
76 -
 77
77 -
 78
78 -
 79
79 -
 80
80 -
 81
81 -
 82
82 -
 83
83 -
 84
84 -
 85
85 -
 86
86 -
 87
87 -
 88
88 -
 89
89 -
 90
90 -
 91
91 -
 92
92 -
 93
93 -
 94
94 -
 95
95 -
 96
96 -
 97
97 -
 98
98 -
 99
99 -
 100
100 -
 101
101 -
 102
102 -
 103
103 -
 104
104 -
 105
105 -
 106
106 -
 107
107 -
 108
108 -
 109
109 -
 110
110 -
 111
111 -
 112
112 -
 113
113 -
 114
114 -
 115
115 -
 116
116 -
 117
117 -
 118
118 -
 119
119 -
 120
120 -
 121
121 -
 122
122 -
 123
123 -
 124
124 -
 125
125 -
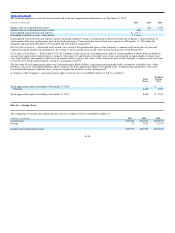 126
126 -
 127
127 -
 128
128 -
 129
129 -
 130
130 -
 131
131 -
 132
132 -
 133
133 -
 134
134 -
 135
135 -
 136
136 -
 137
137 -
 138
138 -
 139
139 -
 140
140 -
 141
141 -
 142
142 -
 143
143 -
 144
144 -
 145
145 -
 146
146 -
 147
147 -
 148
148 -
 149
149 -
 150
150 -
 151
151 -
 152
152 -
 153
153 -
 154
154 -
 155
155 -
 156
156 -
 157
157 -
 158
158 -
 159
159 -
 160
160 -
 161
161 -
 162
162 -
 163
163 -
 164
164 -
 165
165 -
 166
166 -
 167
167 -
 168
168 -
 169
169 -
 170
170 -
 171
171 -
 172
172 -
 173
173 -
 174
174 -
 175
175 -
 176
176 -
 177
177 -
 178
178 -
 179
179 -
 180
180 -
 181
181 -
 182
182 -
 183
183 -
 184
184 -
 185
185 -
 186
186 -
 187
187 -
 188
188 -
 189
189 -
 190
190 -
 191
191 -
 192
192 -
 193
193 -
 194
194 -
 195
195 -
 196
196 -
 197
197 -
 198
198 -
 199
199 -
 200
200 -
 201
201 -
 202
202 -
 203
203 -
 204
204 -
 205
205 -
 206
206 -
 207
207 -
 208
208 -
 209
209 -
 210
210 -
 211
211 -
 212
212 -
 213
213 -
 214
214 -
 215
215 -
 216
216 -
 217
217 -
 218
218 -
 219
219 -
 220
220 -
 221
221 -
 222
222 -
 223
223 -
 224
224 -
 225
225 -
 226
226 -
 227
227 -
 228
228 -
 229
229 -
 230
230 -
 231
231 -
 232
232 -
 233
233 -
 234
234 -
 235
235 -
 236
236 -
 237
237 -
 238
238 -
 239
239 -
 240
240 -
 241
241 -
 242
242 -
 243
243 -
 244
244 -
 245
245 -
 246
246 -
 247
247 -
 248
248 -
 249
249
 |
 |

Table of Contents
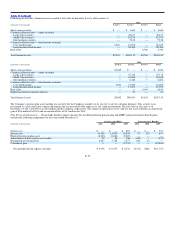
Following are the Plan’s financial assets recorded at fair value by hierarchy level as of December 31:
2011
(Amounts in thousands) Level 1 Level 2 Level 3 Total
Short−term securities $ — $ 1,644 $ — $ 1,644
Common collective trust — equity securities
Large Cap securities — 46,133 — 46,133
Small Cap securities — 10,274 — 10,274
International securities — 5,126 — 5,126
Common collective trust — fixed income securities
Core fixed income 5,267 16,558 — 21,825
Long duration fixed income — 20,380 — 20,380
Real estate — — 4,760 4,760
Total financial assets $5,267 $100,115 $4,760 $110,142
2010
(Amounts in thousands) Level 1 Level 2 Level 3 Total
Short−term securities $1,949 $ — $ — $ 1,949
Common collective trust — equity securities
Large Cap securities — 47,178 — 47,178
Small Cap securities — 10,641 — 10,641
International securities — 6,282 — 6,282
Common collective trust — fixed income securities
Core fixed income 4,943 13,949 — 18,892
Long duration fixed income — 17,973 — 17,973
Real estate — — 4,194 4,194
Experience fund investment contracts — 27 — 27
Total financial assets $6,892 $96,050 $4,194 $107,136
The Company’s pension plan assets include one security that the Company considers to be a Level 3 asset for valuation purposes. This security is an
investment in a real estate joint venture and requires the use of unobservable inputs in its fair value measurement. The fair value of this asset as of
December 31, 2011 and 2010 was $4.8 million and $4.2 million, respectively. The change in reported net asset value for this asset resulted in an unrealized
gain of $0.6 million for 2011 and an unrealized loss of $1.5 million for 2010.
Plan Financial Information — Net periodic benefit expense (income) for the defined benefit pension plan and SERPs and postretirement benefit plans
includes the following components for the years ended December 31:
Pension and SERPs Postretirement Benefits
(Amounts in thousands) 2011 2010 2009 2011 2010 2009
Service cost $ — $ — $ 894 $ — $ — $ 572
Interest cost 11,365 11,876 12,659 51 253 837
Expected return on plan assets (8,223) (8,664) (9,403) — — —
Amortization of prior service cost (credit) 29 84 346 (626) — (352)
Recognized net actuarial loss 6,287 4,782 3,777 244 15 —
Curtailment gain — — (1,535) — — (12,804)
Net periodic benefit expense (income) $ 9,458 $ 8,078 $ 6,738 $(331) $268 $(11,747)
F−35
