MoneyGram 2011 Annual Report Download - page 6
Download and view the complete annual report
Please find page 6 of the 2011 MoneyGram annual report below. You can navigate through the pages in the report by either clicking on the pages listed below, or by using the keyword search tool below to find specific information within the annual report.-
 1
1 -
 2
2 -
 3
3 -
 4
4 -
 5
5 -
 6
6 -
 7
7 -
 8
8 -
 9
9 -
 10
10 -
 11
11 -
 12
12 -
 13
13 -
 14
14 -
 15
15 -
 16
16 -
 17
17 -
18
-
19
-
20
-
21
-
22
-
23
-
24
-
25
-
26
-
27
-
28
-
29
-
30
-
31
-
32
-
33
-
34
-
35
-
36
-
37
-
38
-
39
-
40
-
41
-
42
-
43
-
44
-
45
-
46
-
47
-
48
-
49
-
50
-
51
-
52
-
53
-
54
-
55
-
56
-
57
-
58
-
59
-
60
-
61
-
62
-
63
-
64
-
65
-
66
-
67
-
68
-
69
-
70
-
71
-
72
-
73
-
74
-
75
-
76
-
77
-
78
-
79
-
80
-
81
-
82
-
83
-
84
-
85
-
86
-
87
-
88
-
89
-
90
-
91
-
92
-
93
-
94
-
95
-
96
-
97
-
98
-
99
-
100
-
101
-
102
-
103
-
104
-
105
-
106
-
107
-
108
-
109
-
110
-
111
-
112
-
113
-
114
-
115
-
116
-
117
-
118
-
119
-
120
-
121
-
122
-
123
-
124
-
125
-
126
-
127
-
128
-
129
-
130
-
131
-
132
-
133
-
134
-
135
-
136
-
137
-
138
-
139
-
140
-
141
-
142
-
143
-
144
-
145
-
146
-
147
-
148
-
149
-
150
-
151
-
152
-
153
-
154
-
155
-
156
-
157
-
158
-
159
-
160
-
161
-
162
-
163
-
164
-
165
-
166
-
167
-
168
-
169
-
170
-
171
-
172
-
173
-
174
-
175
-
176
-
177
-
178
-
179
-
180
-
181
-
182
-
183
-
184
-
185
-
186
-
187
-
188
-
189
-
190
-
191
-
192
-
193
-
194
-
195
-
196
-
197
-
198
-
199
-
200
-
201
-
202
-
203
-
204
-
205
-
206
-
207
-
208
-
209
-
210
-
211
-
212
-
213
-
214
-
215
-
216
-
217
-
218
-
219
-
220
-
221
-
222
-
223
-
224
-
225
-
226
-
227
-
228
-
229
-
230
-
231
-
232
-
233
-
234
-
235
-
236
-
237
-
238
-
239
-
240
-
241
-
242
-
243
-
244
-
245
-
246
-
247
-
248
-
249
 |
 |

Table of Contents
respectively, of the fee and investment revenue of our Global Funds Transfer segment. Wal−Mart Stores, Inc. is our only agent that accounts for more than
10 percent of our total company fee and investment revenue. In 2011,
2010 and 2009, Wal−Mart accounted for 29 percent, 30 percent and 29 percent, respectively, of our total company fee and investment revenue, and 31
percent, 32 percent and 32 percent, respectively, of the fee and investment revenue of our Global Funds Transfer segment. Our contract with Wal−Mart in
the United States, which runs through January 2013, provides for Wal−Mart’s sale of our money order and money transfer services and real−time, urgent
bill payment services at its retail locations on an exclusive basis.
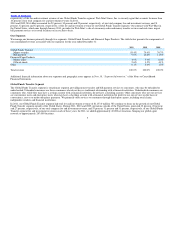
Our Segments
We manage our business primarily through two segments: Global Funds Transfer and Financial Paper Products. The table below presents the components of
our consolidated revenue associated with our segments for the year ended December 31:
2011 2010 2009
Global Funds Transfer
Money transfer 83.4% 79.4% 76.7%
Bill payment 9.0% 10.8% 11.6%
Financial Paper Products
Money order 4.9% 5.9% 6.4%
Official check 2.6% 3.5% 4.1%
Other 0.1% 0.4% 1.2%
Total revenue 100.0% 100.0% 100.0%
Additional financial information about our segments and geographic areas appears in Note 16, “Segment Information,” of the Notes to Consolidated
Financial Statements.
Global Funds Transfer Segment
The Global Funds Transfer segment is our primary segment, providing money transfer and bill payment services to consumers, who may be unbanked or
underbanked. Unbanked consumers are those consumers who do not have a traditional relationship with a financial institution. Underbanked consumers are
consumers who, while they may have a savings account with a financial institution, do not have a checking account. Other consumers who use our services
are convenience users and emergency users who may have a checking account with a financial institution but prefer to use our services on the basis of
convenience, cost or to make emergency payments. We primarily offer services to consumers through third−party agents, including retail chains,
independent retailers and financial institutions.
In 2011, our Global Funds Transfer segment had total fee and investment revenue of $1,153.0 million. We continue to focus on the growth of our Global
Funds Transfer segment outside of the United States. During 2011, 2010 and 2009, operations outside of the United States generated 32 percent, 28 percent
and 27 percent, respectively, of our total company fee and investment revenue, and 35 percent, 31 percent and 31 percent, respectively, of our Global Funds
Transfer segment fee and investment revenue in each of these years. In 2011, we added approximately 40,000 net locations, bringing our global agent
network to approximately 267,000 locations.
5