MoneyGram 2011 Annual Report Download - page 41
Download and view the complete annual report
Please find page 41 of the 2011 MoneyGram annual report below. You can navigate through the pages in the report by either clicking on the pages listed below, or by using the keyword search tool below to find specific information within the annual report.-
 1
1 -
2
-
3
-
4
-
5
-
6
-
7
-
8
-
9
-
10
-
11
-
12
-
13
-
14
-
15
-
16
-
17
-
18
-
19
-
20
-
21
-
22
-
23
-
24
-
25
-
26
-
27
-
28
-
29
-
30
-
 31
31 -
 32
32 -
 33
33 -
 34
34 -
 35
35 -
 36
36 -
 37
37 -
 38
38 -
 39
39 -
 40
40 -
 41
41 -
 42
42 -
 43
43 -
 44
44 -
 45
45 -
 46
46 -
 47
47 -
 48
48 -
 49
49 -
 50
50 -
 51
51 -
52
-
53
-
54
-
55
-
56
-
57
-
58
-
59
-
60
-
61
-
62
-
63
-
64
-
65
-
66
-
67
-
68
-
69
-
70
-
71
-
72
-
73
-
74
-
75
-
76
-
77
-
78
-
79
-
80
-
81
-
82
-
83
-
84
-
85
-
86
-
87
-
88
-
89
-
90
-
91
-
92
-
93
-
94
-
95
-
96
-
97
-
98
-
99
-
100
-
101
-
102
-
103
-
104
-
105
-
106
-
107
-
108
-
109
-
110
-
111
-
112
-
113
-
114
-
115
-
116
-
117
-
118
-
119
-
120
-
121
-
122
-
123
-
124
-
125
-
126
-
127
-
128
-
129
-
130
-
131
-
132
-
133
-
134
-
135
-
136
-
137
-
138
-
139
-
140
-
141
-
142
-
143
-
144
-
145
-
146
-
147
-
148
-
149
-
150
-
151
-
152
-
153
-
154
-
155
-
156
-
157
-
158
-
159
-
160
-
161
-
162
-
163
-
164
-
165
-
166
-
167
-
168
-
169
-
170
-
171
-
172
-
173
-
174
-
175
-
176
-
177
-
178
-
179
-
180
-
181
-
182
-
183
-
184
-
185
-
186
-
187
-
188
-
189
-
190
-
191
-
192
-
193
-
194
-
195
-
196
-
197
-
198
-
199
-
200
-
201
-
202
-
203
-
204
-
205
-
206
-
207
-
208
-
209
-
210
-
211
-
212
-
213
-
214
-
215
-
216
-
217
-
218
-
219
-
220
-
221
-
222
-
223
-
224
-
225
-
226
-
227
-
228
-
229
-
230
-
231
-
232
-
233
-
234
-
235
-
236
-
237
-
238
-
239
-
240
-
241
-
242
-
243
-
244
-
245
-
246
-
247
-
248
-
249
 |
 |

Table of Contents
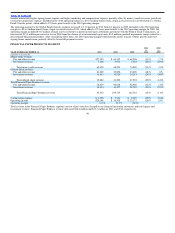
OTHER EXPENSE, NET
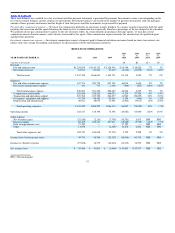
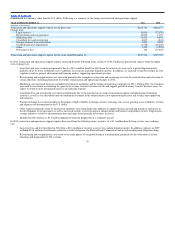
Net Securities Gains — Following is a summary of the components of net securities gains:
2011 2010
vs. vs.
YEAR ENDED DECEMBER 31, 2011 2010 2009 2010 2009
(Amounts in thousands)
Realized gains from available−for−sale investments $(32,820) $ — $ — $(32,820) $ —
Realized losses from available−for−sale investments — — 2 — (2)
Other−than−temporary impairments from available−for−sale investments 4 334 4,069 (330) (3,735)
Valuation gains on trading investments and related put options — — (4,304) — 4,304
Realized gains from trading investments and related put options — (2,449) (7,557) 2,449 5,108
Net securities gains $(32,816) $(2,115) $(7,790) $(30,701) $ 5,675
Net securities gains of $32.8 million in 2011 reflect the receipt of settlements equal to all outstanding principal from two securities classified in “other
asset−backed securities.” These securities had previously been written down to a nominal fair value. In 2010, net securities gains include a $2.4 million
realized gain from the call of a trading investment, net of the reversal of the related put option, partially offset by $0.3 million of other−than−temporary
impairments related to other asset−backed securities. Net securities gains of $7.8 million in 2009 reflect a $7.6 million net realized gain from the call of two
trading investments, net of the reversal of the related put options. Valuation gains of $4.3 million on the put option related to the remaining trading
investment were partially offset by $4.1 million of other−than−temporary impairments related to other asset−backed securities.
Interest expense — Interest expense decreased to $86.2 million in 2011 from $102.1 million in 2010 due to lower interest rates from our refinancing
activities, partially offset by higher debt balances. Based on our outstanding debt balances and interest rates in effect at December 31, 2011, our interest
expense is estimated at approximately $65.4 million in 2012. This amount will be reduced by any prepayments of debt we may make in 2012. As a result of
our debt refinancings in 2011, we anticipate a significant reduction in interest expense in 2012.
Interest expense decreased to $102.1 million in 2010 from $107.9 million in 2009 from lower outstanding debt balances, partially offset by $8.6 million of
pro rata write−offs of deferred financing costs and debt discount related to the $165.0 million of debt prepayments in 2011. In 2009, we recorded a
$2.7 million pro rata write−off of deferred financing costs and debt discount in connection with the prepayment of $185.0 million of debt in 2009.
Debt Extinguishment Loss — The Company recognized total debt extinguishment losses of $37.5 million in 2011. In connection with the refinancing of our
2008 senior debt facility in May 2011, we recorded $5.2 million of debt extinguishment costs, primarily from the write−off of unamortized deferred
financing costs. In connection with the partial redemption of the Second Lien Notes in November 2011, the Company incurred a prepayment penalty of
$23.2 million and wrote−off $9.1 million of unamortized deferred financing costs. See Note 9 — Debt in the Notes to Consolidated Financial Statements for
further information.
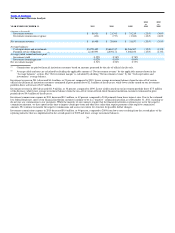
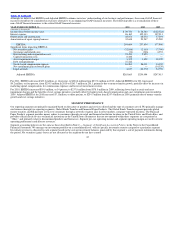
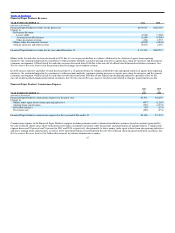
Other — Other expenses as summarized below include items deemed to be non−operating based on management’s assessment of the nature of the item in
relation to our core operations.
(Amounts in thousands) 2011 2010 2009
Capital transaction costs $ 6,446 $ — $ —
Disposal loss from asset dispositions 972 — —
Impairment loss from asset dispositions 4,458 — —
Gain on forward foreign currency contracts — — (2,401)
Total other $11,876 $ — $(2,401)
40