Experian 2011 Annual Report Download - page 95
Download and view the complete annual report
Please find page 95 of the 2011 Experian annual report below. You can navigate through the pages in the report by either clicking on the pages listed below, or by using the keyword search tool below to find specific information within the annual report.-
 1
1 -
2
-
3
-
4
-
5
-
6
-
7
-
8
-
9
-
10
-
11
-
12
-
13
-
14
-
15
-
16
-
17
-
18
-
19
-
20
-
21
-
22
-
23
-
24
-
25
-
26
-
27
-
28
-
29
-
30
-
31
-
32
-
33
-
34
-
35
-
36
-
37
-
38
-
39
-
40
-
41
-
42
-
43
-
44
-
45
-
46
-
47
-
48
-
49
-
50
-
51
-
52
-
53
-
54
-
55
-
56
-
57
-
58
-
59
-
60
-
61
-
62
-
63
-
64
-
65
-
66
-
67
-
68
-
69
-
70
-
71
-
72
-
73
-
74
-
75
-
76
-
77
-
78
-
79
-
80
-
81
-
82
-
83
-
84
-
 85
85 -
 86
86 -
 87
87 -
 88
88 -
 89
89 -
 90
90 -
 91
91 -
 92
92 -
 93
93 -
 94
94 -
 95
95 -
 96
96 -
 97
97 -
 98
98 -
 99
99 -
 100
100 -
 101
101 -
 102
102 -
 103
103 -
 104
104 -
 105
105 -
106
-
107
-
108
-
109
-
110
-
111
-
112
-
113
-
114
-
115
-
116
-
117
-
118
-
119
-
120
-
121
-
122
-
123
-
124
-
125
-
126
-
127
-
128
-
129
-
130
-
131
-
132
-
133
-
134
-
135
-
136
-
137
-
138
-
139
-
140
-
141
-
142
-
143
-
144
-
145
-
146
-
147
-
148
-
149
-
150
-
151
-
152
-
153
-
154
-
155
-
156
-
157
-
158
-
159
-
160
-
161
-
162
-
163
-
164
 |
 |

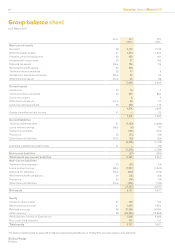
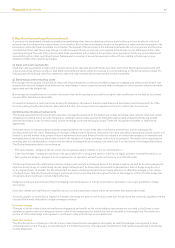
Financial statements 93
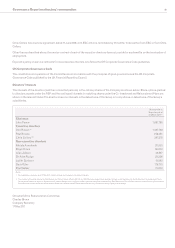
Non-GAAP measures
Reconciliation of prot before tax to Benchmark PBT
for the year ended 31 March 2011
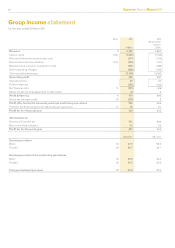
Group statement of comprehensive income
for the year ended 31 March 2011
2011
US$m
2010
US$m
Prot for the nancial year 623 636
Other comprehensive income:
Fair value gains – available for sale nancial assets 5 5
Actuarial gains/(losses) – dened benet pension plans 77 (20)
Currency translation differences 142 209
Reclassication of cumulative fair value losses – available for sale nancial assets – 5
Total other comprehensive income for the nancial year, net of tax (note 16 (a)) 224 199
Total comprehensive income for the nancial year, net of tax 847 835
Attributable to:
Owners of Experian plc 787 760
Non-controlling interests 60 75
Total comprehensive income for the nancial year, net of tax 847 835
Notes 2011
US$m
2010
(Re-presented)
(Note 3)
US$m
Prot before tax 9679 600
Exceptional items 13(a) 2 68
Amortisation of acquisition intangibles 13(b) 129 140
Acquisition expenses 13(b) 8 –
Charges in respect of the demerger-related equity incentive plans 13(b) 13 28
Financing fair value remeasurements 13(b) 142 18
Benchmark PBT – continuing operations 9973 854
Benchmark earnings per share from continuing operations US cents US cents
Basic 18 70.0 63.7
Diluted 18 68.5 62.8