Experian 2011 Annual Report Download - page 94
Download and view the complete annual report
Please find page 94 of the 2011 Experian annual report below. You can navigate through the pages in the report by either clicking on the pages listed below, or by using the keyword search tool below to find specific information within the annual report.-
 1
1 -
2
-
3
-
4
-
5
-
6
-
7
-
8
-
9
-
10
-
11
-
12
-
13
-
14
-
15
-
16
-
17
-
18
-
19
-
20
-
21
-
22
-
23
-
24
-
25
-
26
-
27
-
28
-
29
-
30
-
31
-
32
-
33
-
34
-
35
-
36
-
37
-
38
-
39
-
40
-
41
-
42
-
43
-
44
-
45
-
46
-
47
-
48
-
49
-
50
-
51
-
52
-
53
-
54
-
55
-
56
-
57
-
58
-
59
-
60
-
61
-
62
-
63
-
64
-
65
-
66
-
67
-
68
-
69
-
70
-
71
-
72
-
73
-
74
-
75
-
76
-
77
-
78
-
79
-
80
-
81
-
82
-
83
-
 84
84 -
 85
85 -
 86
86 -
 87
87 -
 88
88 -
 89
89 -
 90
90 -
 91
91 -
 92
92 -
 93
93 -
 94
94 -
 95
95 -
 96
96 -
 97
97 -
 98
98 -
 99
99 -
 100
100 -
 101
101 -
 102
102 -
 103
103 -
 104
104 -
105
-
106
-
107
-
108
-
109
-
110
-
111
-
112
-
113
-
114
-
115
-
116
-
117
-
118
-
119
-
120
-
121
-
122
-
123
-
124
-
125
-
126
-
127
-
128
-
129
-
130
-
131
-
132
-
133
-
134
-
135
-
136
-
137
-
138
-
139
-
140
-
141
-
142
-
143
-
144
-
145
-
146
-
147
-
148
-
149
-
150
-
151
-
152
-
153
-
154
-
155
-
156
-
157
-
158
-
159
-
160
-
161
-
162
-
163
-
164
 |
 |

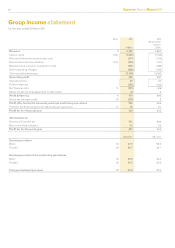
92 Experian Annual Report 2011
Group income statement
for the year ended 31 March 2011
Notes 2011
US$m
2010
(Re-presented)
(Note 3)
US$m
Revenue 94,239 3,880
Labour costs 11(a) (1,525) (1,514)
Data and information technology costs (317) (319)
Depreciation and amortisation 11(b) (420) (417)
Marketing and customer acquisition costs (594) (489)
Other operating charges (489) (444)
Total operating expenses (3,345) (3,183)
Operating prot 894 697
Interest income 69 64
Finance expense (282) (163)
Net nance costs 14 (213) (99)
Share of post-tax (losses)/prots of associates (2) 2
Prot before tax 9679 600
Group tax (charge)/credit 15 (129) 9
Prot after tax for the nancial year from continuing operations 550 609
Prot for the nancial year from discontinued operations 17 73 27
Prot for the nancial year 623 636
Attributable to:
Owners of Experian plc 581 600
Non-controlling interests 42 36
Prot for the nancial year 623 636
US cents US cents
Earnings per share
Basic 18 57.9 59.0
Diluted 18 56.7 58.1
Earnings per share from continuing operations
Basic 18 50.6 56.4
Diluted 18 49.5 55.5
Full year dividend per share 19 28.0 23.0