Experian 2011 Annual Report Download - page 119
Download and view the complete annual report
Please find page 119 of the 2011 Experian annual report below. You can navigate through the pages in the report by either clicking on the pages listed below, or by using the keyword search tool below to find specific information within the annual report.-
 1
1 -
2
-
3
-
4
-
5
-
6
-
7
-
8
-
9
-
10
-
11
-
12
-
13
-
14
-
15
-
16
-
17
-
18
-
19
-
20
-
21
-
22
-
23
-
24
-
25
-
26
-
27
-
28
-
29
-
30
-
31
-
32
-
33
-
34
-
35
-
36
-
37
-
38
-
39
-
40
-
41
-
42
-
43
-
44
-
45
-
46
-
47
-
48
-
49
-
50
-
51
-
52
-
53
-
54
-
55
-
56
-
57
-
58
-
59
-
60
-
61
-
62
-
63
-
64
-
65
-
66
-
67
-
68
-
69
-
70
-
71
-
72
-
73
-
74
-
75
-
76
-
77
-
78
-
79
-
80
-
81
-
82
-
83
-
84
-
85
-
86
-
87
-
88
-
89
-
90
-
91
-
92
-
93
-
94
-
95
-
96
-
97
-
98
-
99
-
100
-
101
-
102
-
103
-
104
-
105
-
106
-
107
-
108
-
 109
109 -
 110
110 -
 111
111 -
 112
112 -
 113
113 -
 114
114 -
 115
115 -
 116
116 -
 117
117 -
 118
118 -
 119
119 -
 120
120 -
 121
121 -
 122
122 -
 123
123 -
 124
124 -
 125
125 -
 126
126 -
 127
127 -
 128
128 -
 129
129 -
130
-
131
-
132
-
133
-
134
-
135
-
136
-
137
-
138
-
139
-
140
-
141
-
142
-
143
-
144
-
145
-
146
-
147
-
148
-
149
-
150
-
151
-
152
-
153
-
154
-
155
-
156
-
157
-
158
-
159
-
160
-
161
-
162
-
163
-
164
 |
 |

Financial statements 117
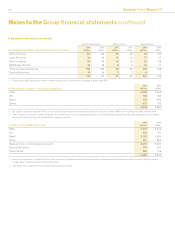
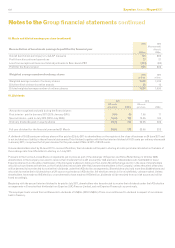
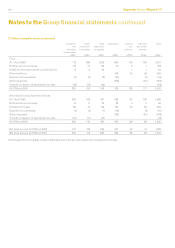
14. Net nance costs
(a) Net nance costs 2011
US$m
2010
(Re-presented)
(Note 3)
US$m
Interest income:
Bank deposits and short-term investments (13) (17)
Expected return on pension plan assets (56) (47)
Interest income (69) (64)
Finance expense:
Bank loans and overdrafts 619
Eurobonds and notes 66 41
Commitment and facility fees 62
Unwind of discounts 25
Interest differentials on derivatives 929
Finance lease interest expense 11
Interest expense on pension plan liabilities 50 48
Interest expense 140 145
Charge in respect of nancing fair value remeasurements (note 14(c)) 142 18
Finance expense 282 163
Net nance costs 213 99
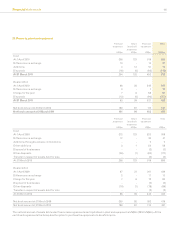
(b) Net interest expense included in Benchmark PBT
Interest income (69) (64)
Interest expense 140 145
Net interest expense included in Benchmark PBT 71 81
(c) Analysis of charge in respect of nancing fair value remeasurements
Fair value (gains)/losses on borrowings attributable to interest rate risk (22) 4
Fair value losses/(gains) on borrowings attributable to currency risk 38 (16)
Losses/(gains) on interest rate swaps – fair value hedges 9 (3)
(Gains)/losses on cross currency swaps – fair value hedges (6) 22
Fair value gains on non-hedging derivatives (26) (44)
Losses in connection with commitments to purchase own shares 2 -
Foreign exchange losses/(gains) on nancing activities 8 (58)
Increase in fair value of put options – principally Serasa 139 113
Charge in respect of nancing fair value remeasurements 142 18
An indication of the sensitivity of the Group’s results to interest rate risk is given in note 8.