Experian 2011 Annual Report Download - page 22
Download and view the complete annual report
Please find page 22 of the 2011 Experian annual report below. You can navigate through the pages in the report by either clicking on the pages listed below, or by using the keyword search tool below to find specific information within the annual report.-
 1
1 -
2
-
3
-
4
-
5
-
6
-
7
-
8
-
9
-
10
-
11
-
 12
12 -
 13
13 -
 14
14 -
 15
15 -
 16
16 -
 17
17 -
 18
18 -
 19
19 -
 20
20 -
 21
21 -
 22
22 -
 23
23 -
 24
24 -
 25
25 -
 26
26 -
 27
27 -
 28
28 -
 29
29 -
 30
30 -
 31
31 -
 32
32 -
33
-
34
-
35
-
36
-
37
-
38
-
39
-
40
-
41
-
42
-
43
-
44
-
45
-
46
-
47
-
48
-
49
-
50
-
51
-
52
-
53
-
54
-
55
-
56
-
57
-
58
-
59
-
60
-
61
-
62
-
63
-
64
-
65
-
66
-
67
-
68
-
69
-
70
-
71
-
72
-
73
-
74
-
75
-
76
-
77
-
78
-
79
-
80
-
81
-
82
-
83
-
84
-
85
-
86
-
87
-
88
-
89
-
90
-
91
-
92
-
93
-
94
-
95
-
96
-
97
-
98
-
99
-
100
-
101
-
102
-
103
-
104
-
105
-
106
-
107
-
108
-
109
-
110
-
111
-
112
-
113
-
114
-
115
-
116
-
117
-
118
-
119
-
120
-
121
-
122
-
123
-
124
-
125
-
126
-
127
-
128
-
129
-
130
-
131
-
132
-
133
-
134
-
135
-
136
-
137
-
138
-
139
-
140
-
141
-
142
-
143
-
144
-
145
-
146
-
147
-
148
-
149
-
150
-
151
-
152
-
153
-
154
-
155
-
156
-
157
-
158
-
159
-
160
-
161
-
162
-
163
-
164
 |
 |

Experian Annual Report 2011
20
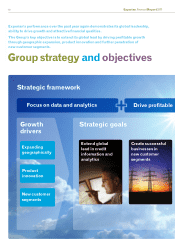
Key performance indicators
Experian uses a number of key metrics to assess its performance. Experian’s financial
objectives are to drive organic revenue growth, to maintain or grow EBIT margins and to
convert at least 90% of EBIT into operating cash flow. The Group also deploys a series of
non-financial indicators to monitor and gauge performance.
Organic growth Acquired growth
See the financial review for definition of total revenue growth.
For further information on revenue split by operating
and business segment, see note 9 to the Group
financial statements.
14% 14%
8%
2%
10%
07 08 09 10 11
Total revenue growth
In the year ended 31 March 2011, Experian
increased its total revenue from
continuing activities by 10% at constant
exchange rates. Total continuing
revenue increased by US$411m.
2007 to 2010 restated to exclude FARES.
See the Group financial statements and the financial
review for definition of operating cash flow and cash
flow conversion.
For additional information on cash flow see the
Group cash flow statement.
See the financial review for definition of organic
revenue growth.
07 08 09 10 11
8%
4%
3%
2%
8%
Organic revenue growth
Experian returned to its target of mid-
to-high single digit organic revenue
growth in the year ended 31 March 2011,
increasing by 8%, with growth across all
regions and business activities.
47%
48%
59%
64% 67%
07 08 09 10 11
Percentage of revenue from
customer segments other than
financial services
Experian aims to diversify beyond
financial services by expanding into
new customer segments including
SME, healthcare payments, insurance,
public sector, telecommunications
and utilities. Experian now generates
67% of revenue from non-financial
verticals.
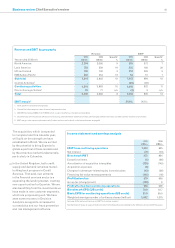
EBIT (US$m) and margin
In the year ended 31 March 2011, Experian
increased its total EBIT at constant
exchange rates by 12% to US$1,044m. EBIT
from continuing activities increased 11% at
constant exchange rates.
The Group again met its margin objective,
with a 30 basis points expansion in margin
from continuing activities to 24.8%. This
was achieved while continuing to invest
organically in future growth initiatives.
07 08 09 10 11
21%
18%
18%
17%
15%
Revenue dependence on top 20 clients
(percentage of total revenue)
Experian aims to reduce its reliance on
any single client and to increase the
balance and diversity of its revenue base.
In the year ended 31 March 2011, the
Group made progress against this
objective with further reduction in
revenue dependency on our top 20
clients.
2007 to 2010 restated to exclude FARES.
EBIT includes discontinuing activities.
07 08 09 10 11
21.9%
764
23.6%
891
24.5%
935
24.8%
1,044
22.8%
854
Cash flow (US$m) and cash flow
conversion
Experian aims to convert at least 90% of
its EBIT into operating cash flow each
year. In the year ended 31 March 2011,
this target was exceeded, converting
98% of EBIT into operating cash flow.
07 08 09 10 11
100%
765
99%
848
101%
897
98%
1,028
100%
935