Experian 2011 Annual Report Download - page 3
Download and view the complete annual report
Please find page 3 of the 2011 Experian annual report below. You can navigate through the pages in the report by either clicking on the pages listed below, or by using the keyword search tool below to find specific information within the annual report.-
 1
1 -
 2
2 -
 3
3 -
 4
4 -
 5
5 -
 6
6 -
 7
7 -
 8
8 -
 9
9 -
 10
10 -
 11
11 -
 12
12 -
 13
13 -
 14
14 -
15
-
16
-
17
-
18
-
19
-
20
-
21
-
22
-
23
-
24
-
25
-
26
-
27
-
28
-
29
-
30
-
31
-
32
-
33
-
34
-
35
-
36
-
37
-
38
-
39
-
40
-
41
-
42
-
43
-
44
-
45
-
46
-
47
-
48
-
49
-
50
-
51
-
52
-
53
-
54
-
55
-
56
-
57
-
58
-
59
-
60
-
61
-
62
-
63
-
64
-
65
-
66
-
67
-
68
-
69
-
70
-
71
-
72
-
73
-
74
-
75
-
76
-
77
-
78
-
79
-
80
-
81
-
82
-
83
-
84
-
85
-
86
-
87
-
88
-
89
-
90
-
91
-
92
-
93
-
94
-
95
-
96
-
97
-
98
-
99
-
100
-
101
-
102
-
103
-
104
-
105
-
106
-
107
-
108
-
109
-
110
-
111
-
112
-
113
-
114
-
115
-
116
-
117
-
118
-
119
-
120
-
121
-
122
-
123
-
124
-
125
-
126
-
127
-
128
-
129
-
130
-
131
-
132
-
133
-
134
-
135
-
136
-
137
-
138
-
139
-
140
-
141
-
142
-
143
-
144
-
145
-
146
-
147
-
148
-
149
-
150
-
151
-
152
-
153
-
154
-
155
-
156
-
157
-
158
-
159
-
160
-
161
-
162
-
163
-
164
 |
 |

Highlights Contents 1
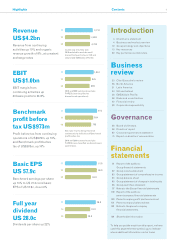
Full year
dividend
US 28.0c
Dividends per share up 22%
28.0
23.0
20.0
09
10
11
Continuing activities only.
2010 restated to exclude small
discontinuing activities in UK and
Ireland and EMEA/Asia Pacific.
3,803
10
3,79009
4,21411
Revenue
US$4.2bn
Revenue from continuing
activities up 10% and organic
revenue growth of 8%, at constant
exchange rates
2010 and 2009 restated to exclude
FARES (now classified as
discontinued operations).
1,044
935
896
09
10
11
EBIT
US$1.0bn
EBIT margin from
continuing activities up
30 basis points to 24.8%
See note 7 to the Group financial
statements for definition of Benchmark
profit before tax.
2010 and 2009 restated to exclude
FARES (now classified as discontinued
operations).
854
973
795
09
10
11
Benchmark
profit before
tax US$973m
Profit before tax from continuing
operations of US$679m, up 13%,
and Benchmark profit before
tax of US$973m, up 14%
57.9
59.0
48.0
09
10
11
Basic EPS
US 57.9c
Benchmark earnings per share
up 10% to US 70.0c and basic
EPS of US 57.9c, down 2%
Introduction
3 Chairman’s statement
4 Business and market overview
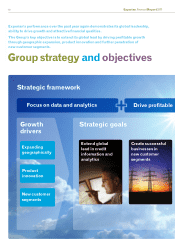
10 Group strategy and objectives
13 Key resources
20 Key performance indicators
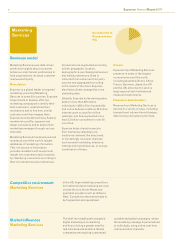
Business
review
23 Chief Executive’s review
28 North America
31 Latin America
33 UK and Ireland
36 EMEA/Asia Pacific
38 Risks and uncertainties
42 Financial review
50 Corporate responsibility
Governance
56 Board of directors
58 Directors’ report
62 Corporate governance statement
74 Report on directors’ remuneration
Financial
statements
91 Report of the auditors:
Group financial statements
92 Group income statement
93 Group statement of comprehensive income
94 Group balance sheet
95 Group statement of changes in total equity
96 Group cash flow statement
97 Notes to the Group financial statements
149 Report of the auditors:
parent company financial statements
150 Parent company profit and loss account
151 Parent company balance sheet
152 Notes to the parent company
financial statements
159 Shareholder information
To help you get the most from this report, we have
used this page reference symbol,
00
, to indicate
where additional information can be found.