Experian 2011 Annual Report Download - page 127
Download and view the complete annual report
Please find page 127 of the 2011 Experian annual report below. You can navigate through the pages in the report by either clicking on the pages listed below, or by using the keyword search tool below to find specific information within the annual report.-
 1
1 -
2
-
3
-
4
-
5
-
6
-
7
-
8
-
9
-
10
-
11
-
12
-
13
-
14
-
15
-
16
-
17
-
18
-
19
-
20
-
21
-
22
-
23
-
24
-
25
-
26
-
27
-
28
-
29
-
30
-
31
-
32
-
33
-
34
-
35
-
36
-
37
-
38
-
39
-
40
-
41
-
42
-
43
-
44
-
45
-
46
-
47
-
48
-
49
-
50
-
51
-
52
-
53
-
54
-
55
-
56
-
57
-
58
-
59
-
60
-
61
-
62
-
63
-
64
-
65
-
66
-
67
-
68
-
69
-
70
-
71
-
72
-
73
-
74
-
75
-
76
-
77
-
78
-
79
-
80
-
81
-
82
-
83
-
84
-
85
-
86
-
87
-
88
-
89
-
90
-
91
-
92
-
93
-
94
-
95
-
96
-
97
-
98
-
99
-
100
-
101
-
102
-
103
-
104
-
105
-
106
-
107
-
108
-
109
-
110
-
111
-
112
-
113
-
114
-
115
-
116
-
 117
117 -
 118
118 -
 119
119 -
 120
120 -
 121
121 -
 122
122 -
 123
123 -
 124
124 -
 125
125 -
 126
126 -
 127
127 -
 128
128 -
 129
129 -
 130
130 -
 131
131 -
 132
132 -
 133
133 -
 134
134 -
 135
135 -
 136
136 -
 137
137 -
138
-
139
-
140
-
141
-
142
-
143
-
144
-
145
-
146
-
147
-
148
-
149
-
150
-
151
-
152
-
153
-
154
-
155
-
156
-
157
-
158
-
159
-
160
-
161
-
162
-
163
-
164
 |
 |

Financial statements 125
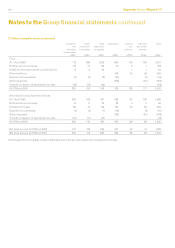
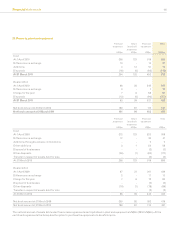
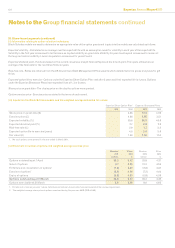
22. Property, plant and equipment
Freehold
properties
US$m
Short
leasehold
properties
US$m
Plant and
equipment
US$m
Total
US$m
Cost
At 1 April 2010 256 123 516 895
Differences on exchange 13 - 14 27
Additions 4 13 57 74
Disposals (19) (4) (95) (118)
At 31 March 2011 254 132 492 878
Depreciation
At 1 April 2010 66 36 342 444
Differences on exchange 3 - 7 10
Charge for the year 7 6 68 81
Disposals (13) (4) (90) (107)
At 31 March 2011 63 38 327 428
Net book amount at 31 March 2010 190 87 174 451
Net book amount at 31 March 2011 191 94 165 450
Freehold
properties
US$m
Short
leasehold
properties
US$m
Plant and
equipment
US$m
Total
US$m
Cost
At 1 April 2009 272 123 523 918
Differences on exchange 17 - 24 41
Additions through business combinations - - 2 2
Other additions 3 1 54 58
Disposal of businesses - - (3) (3)
Other disposals (36) (1) (80) (117)
Transfer in respect of assets held for sale - - (4) (4)
At 31 March 2010 256 123 516 895
Depreciation
At 1 April 2009 67 31 341 439
Differences on exchange 2 - 11 13
Charge for the year 7 6 72 85
Disposal of businesses - - (2) (2)
Other disposals (10) (1) (78) (89)
Transfer in respect of assets held for sale - - (2) (2)
At 31 March 2010 66 36 342 444
Net book amount at 31 March 2009 205 92 182 479
Net book amount at 31 March 2010 190 87 174 451
The net book amount of assets held under nance lease agreements and capitalised in plant and equipment is US$3m (2010: US$8m). At the
end of such agreements the Group has the option to purchase the equipment at a benecial price.