Experian 2011 Annual Report Download - page 28
Download and view the complete annual report
Please find page 28 of the 2011 Experian annual report below. You can navigate through the pages in the report by either clicking on the pages listed below, or by using the keyword search tool below to find specific information within the annual report.-
 1
1 -
2
-
3
-
4
-
5
-
6
-
7
-
8
-
9
-
10
-
11
-
12
-
13
-
14
-
15
-
16
-
17
-
 18
18 -
 19
19 -
 20
20 -
 21
21 -
 22
22 -
 23
23 -
 24
24 -
 25
25 -
 26
26 -
 27
27 -
 28
28 -
 29
29 -
 30
30 -
 31
31 -
 32
32 -
 33
33 -
 34
34 -
 35
35 -
 36
36 -
 37
37 -
 38
38 -
39
-
40
-
41
-
42
-
43
-
44
-
45
-
46
-
47
-
48
-
49
-
50
-
51
-
52
-
53
-
54
-
55
-
56
-
57
-
58
-
59
-
60
-
61
-
62
-
63
-
64
-
65
-
66
-
67
-
68
-
69
-
70
-
71
-
72
-
73
-
74
-
75
-
76
-
77
-
78
-
79
-
80
-
81
-
82
-
83
-
84
-
85
-
86
-
87
-
88
-
89
-
90
-
91
-
92
-
93
-
94
-
95
-
96
-
97
-
98
-
99
-
100
-
101
-
102
-
103
-
104
-
105
-
106
-
107
-
108
-
109
-
110
-
111
-
112
-
113
-
114
-
115
-
116
-
117
-
118
-
119
-
120
-
121
-
122
-
123
-
124
-
125
-
126
-
127
-
128
-
129
-
130
-
131
-
132
-
133
-
134
-
135
-
136
-
137
-
138
-
139
-
140
-
141
-
142
-
143
-
144
-
145
-
146
-
147
-
148
-
149
-
150
-
151
-
152
-
153
-
154
-
155
-
156
-
157
-
158
-
159
-
160
-
161
-
162
-
163
-
164
 |
 |

Experian Annual Report 2011
26
Chief Executive’s review continued
Marketing Services delivered growth,
with recovery in telecommunications
and utilities helping to offset slower
decision-making in the public
sector segment, while at Interactive,
enhancements to our offer are
delivering greater value to consumers.
We continue to build scale across
EMEA/Asia Pacic, which accounted
for US$0.5bn of Group revenue in the
year. We are seeing strong demand
for our Decision Analytics products,
and feel we are well placed to benet
from rising credit penetration across
emerging markets in Europe, such
as Turkey and Russia. Meanwhile in
Marketing Services, we are beneting
from the investments we have made
to expand our global footprint, which
allows us to grow our business
locally in regional markets as well as
to grow our relationships alongside
multinational organisations. These
factors have more than offset weak
conditions in our more established
bureau markets.
Strategic progress
We made progress during the nancial
year against our ve strategic goals to:
l Extend our global lead in credit
information and analytics;
l Create successful businesses in new
customer segments;
l Build large-scale operations in major
emerging consumer economies;
l Become the global leader in digital
marketing services; and
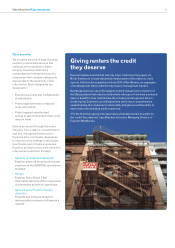
l Become the most trusted consumer
brand for credit information and identity
protection services.
During the year, we invested in a
series of initiatives through our global
growth programme aimed at achieving
these goals. We are pleased with
our progress and, collectively, these
initiatives contributed 2% to organic
revenue growth in the year, which is in
line with our previous expectations.
The top contributing initiatives were
fraud prevention, consumer protection
products, and the telecommunications,
utilities and SME segments.
Our growth focus means that we
continue to deliver against our strategic
metrics, with 29% of Group revenue
now arising from outside the US and
the UK, 67% from non-nancial verticals
and over 10% generated from product
innovations in the past ve years.
Investment to support growth during
FY11 included approximately 200 basis
points of margin, US$374m by way
of capital expenditure and US$301m
through acquisitions.
For FY12, we will continue to invest to
deliver premium growth on a sustained
basis, both organically and through
selective acquisition opportunities.
Some examples of the growth initiatives
we are pursuing include:
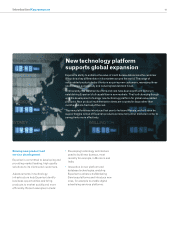
l New technology, as we develop
new platforms and release new
versions of existing software,
bringing new functionality to clients
and supporting cost-effective
expansion in new geographies;
l Completion of the Computec
acquisition and integration into our
Latin America region;
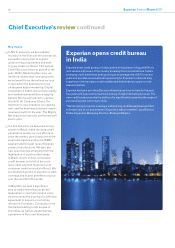
l Organic bureau expansion, in particular
bureau builds in India and Australia;
l Business information development, as
we expand our product range and invest
in new sources of data;
l Multi-channel digital marketing, as
we expand and develop our market
position, for example in the social
media and mobile delivery channels;
and
l Further investment in client service
quality and sales excellence.
In support of these and other initiatives,
we anticipate continued investment
through the income statement in FY12
and capital expenditure in the range of
US$410m to US$440m during that year.
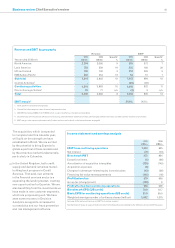
Net debt
Net debt in the year was reduced by
US$126m to US$1,501m at 31 March
2011. EBIT conversion into operating
cash ow was 98%, exceeding our
target of 90% conversion. The reduction
in net debt was after funding net share
purchases of US$349m, consistent
with the previously announced buyback
programme, which has been completed.
At 31 March 2011, the adjusted net
debt to EBITDA gearing ratio was 1.8
times, including the current value of the
Serasa put option of US$870m.
Debt funding
During the year, we completed an 18
month programme to renance our
borrowing facilities, spread debt
maturities and diversify sources of
funding. This included the arrangement
of new ve-year committed revolving
credit facilities totalling US$1,700m with
thirteen leading banks, and the issue in
January 2011 of £400m 4.75% bonds
due 2018, swapped into US dollars.
Following this, our expectation is that
net interest expense will be in the range
of US$65m to US$75m for the year
ending 31 March 2012.
Capital strategy
We remain committed to a prudent but
efcient balance sheet consistent with
our desire to retain a strong investment
grade credit rating. Our target gearing
ratio is 1.75 to 2.0 times, calculated as
net debt adjusted for the current value
of the put option over the minority
shares in Serasa, divided by EBITDA.
36
10