Experian 2011 Annual Report Download - page 114
Download and view the complete annual report
Please find page 114 of the 2011 Experian annual report below. You can navigate through the pages in the report by either clicking on the pages listed below, or by using the keyword search tool below to find specific information within the annual report.-
 1
1 -
2
-
3
-
4
-
5
-
6
-
7
-
8
-
9
-
10
-
11
-
12
-
13
-
14
-
15
-
16
-
17
-
18
-
19
-
20
-
21
-
22
-
23
-
24
-
25
-
26
-
27
-
28
-
29
-
30
-
31
-
32
-
33
-
34
-
35
-
36
-
37
-
38
-
39
-
40
-
41
-
42
-
43
-
44
-
45
-
46
-
47
-
48
-
49
-
50
-
51
-
52
-
53
-
54
-
55
-
56
-
57
-
58
-
59
-
60
-
61
-
62
-
63
-
64
-
65
-
66
-
67
-
68
-
69
-
70
-
71
-
72
-
73
-
74
-
75
-
76
-
77
-
78
-
79
-
80
-
81
-
82
-
83
-
84
-
85
-
86
-
87
-
88
-
89
-
90
-
91
-
92
-
93
-
94
-
95
-
96
-
97
-
98
-
99
-
100
-
101
-
102
-
103
-
 104
104 -
 105
105 -
 106
106 -
 107
107 -
 108
108 -
 109
109 -
 110
110 -
 111
111 -
 112
112 -
 113
113 -
 114
114 -
 115
115 -
 116
116 -
 117
117 -
 118
118 -
 119
119 -
 120
120 -
 121
121 -
 122
122 -
 123
123 -
 124
124 -
125
-
126
-
127
-
128
-
129
-
130
-
131
-
132
-
133
-
134
-
135
-
136
-
137
-
138
-
139
-
140
-
141
-
142
-
143
-
144
-
145
-
146
-
147
-
148
-
149
-
150
-
151
-
152
-
153
-
154
-
155
-
156
-
157
-
158
-
159
-
160
-
161
-
162
-
163
-
164
 |
 |
112 Experian Annual Report 2011
Notes to the Group nancial statements continued
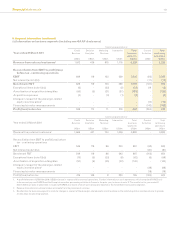
9. Segment information (continued)
Capital expenditure Depreciation1Amortisation1
(iii) Capital expenditure, depreciation and amortisation 2011
US$m
2010
US$m
2011
US$m
2010
US$m
2011
US$m
2010
US$m
North America 141 133 40 42 94 96
Latin America 94 65 15 13 57 47
UK and Ireland 59 54 14 19 26 28
EMEA/Asia Pacic 46 38 9 8 24 17
Total operating segments 340 290 78 82 201 188
Central Activities 34 24 3 3 6 1
374 314 81 85 207 189
1. Depreciation and amortisation within the above analysis only include amounts charged to Benchmark PBT.
(iv) Revenue by country – continuing operations 2011
US$m
2010
US$m
USA 2,249 2,064
UK 738 784
Brazil 715 556
Other 537 476
4,239 3,880
1. No single customer accounted for 10% or more of the Group’s revenue from external customers in the year ended 31 March 2011 and the year ended 31 March 2010.
2. The Company is resident in Ireland. Revenue with Irish external customers represents less than 1% of the Group’s revenue from external customers and accordingly
the Group’s revenue is primarily attributable to foreign countries.
(v) Non-current assets by country 2011
US$m
2010
US$m
USA 2,372 2,340
UK 938 751
Brazil 1,724 1,593
Other 597 550
Segment non-current assets by country 5,631 5,234
Central Activities1191 234
Deferred tax1159 176
5,981 5,644
1. Non-current assets for Central Activities, which principally comprises derivative nancial assets, and deferred tax have been excluded from the analysis by country
to add clarity to the presentation of this information.
2. The Group has no signicant non-current assets located in Ireland.