Experian 2011 Annual Report Download - page 36
Download and view the complete annual report
Please find page 36 of the 2011 Experian annual report below. You can navigate through the pages in the report by either clicking on the pages listed below, or by using the keyword search tool below to find specific information within the annual report.-
 1
1 -
2
-
3
-
4
-
5
-
6
-
7
-
8
-
9
-
10
-
11
-
12
-
13
-
14
-
15
-
16
-
17
-
18
-
19
-
20
-
21
-
22
-
23
-
24
-
25
-
 26
26 -
 27
27 -
 28
28 -
 29
29 -
 30
30 -
 31
31 -
 32
32 -
 33
33 -
 34
34 -
 35
35 -
 36
36 -
 37
37 -
 38
38 -
 39
39 -
 40
40 -
 41
41 -
 42
42 -
 43
43 -
 44
44 -
 45
45 -
 46
46 -
47
-
48
-
49
-
50
-
51
-
52
-
53
-
54
-
55
-
56
-
57
-
58
-
59
-
60
-
61
-
62
-
63
-
64
-
65
-
66
-
67
-
68
-
69
-
70
-
71
-
72
-
73
-
74
-
75
-
76
-
77
-
78
-
79
-
80
-
81
-
82
-
83
-
84
-
85
-
86
-
87
-
88
-
89
-
90
-
91
-
92
-
93
-
94
-
95
-
96
-
97
-
98
-
99
-
100
-
101
-
102
-
103
-
104
-
105
-
106
-
107
-
108
-
109
-
110
-
111
-
112
-
113
-
114
-
115
-
116
-
117
-
118
-
119
-
120
-
121
-
122
-
123
-
124
-
125
-
126
-
127
-
128
-
129
-
130
-
131
-
132
-
133
-
134
-
135
-
136
-
137
-
138
-
139
-
140
-
141
-
142
-
143
-
144
-
145
-
146
-
147
-
148
-
149
-
150
-
151
-
152
-
153
-
154
-
155
-
156
-
157
-
158
-
159
-
160
-
161
-
162
-
163
-
164
 |
 |

Experian Annual Report 2011
34
Interactive
Total and organic revenue growth at
constant exchange rates, was 10%.
Growth in Interactive was driven by
increased membership revenue and
enhanced retention for retail credit
products (CreditExpert).
Financial review
For the UK and Ireland, EBIT from
continuing activities was US$213m, up 5%
at constant exchange rates. EBIT margin
expanded by 80 basis points to 28.9%,
principally reflecting positive operating
leverage in Marketing Services, which
offset negative mix in Credit Services.
Social, ethical and environmental
performance
The UK and Ireland region is very active
in the community and again won awards
from the national charity Business in the
Community (BITC). One of these was to
John Peace, Chairman of Experian and a
champion of community involvement, who
was awarded ‘The Prince’s Ambassador
Award’ by the Prince of Wales. The
region achieved a decrease in its carbon
footprint, which included a 5% reduction
in emissions by the data centre. It also
gained the Carbon Trust Standard and
recertification for ISO14001.
UK and Ireland continued
Ensuring that Experian continues
to have the ‘best data’
The quality and depth of Experian’s data resources has long been a cornerstone
of its success, nowhere more so than in the UK, where the Group has operated
the leading credit bureau for almost three decades. During the past year, Experian
in the UK has been investing in a major new database infrastructure to reinforce
its reputation for having the best data in the market place.
At the core of this investment is a move from siloed data, where information is
stored by category, to person-centric data, where information is maintained
against the individual using a unique personal identification number or PIN.
It enables data to be retrieved more quickly, while also ensuring a more complete
picture of the individual using the full breadth of Experian’s data sources.
Delphi for Customer Management, which allows Experian clients to monitor the
risk profile of their credit customers, was amongst the first products to benefit
from the new infrastructure. The time taken to process client files has now been
reduced by 80% and, just as importantly, the vital information used to make
customer decisions has increased by up to 5%.
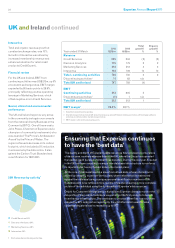
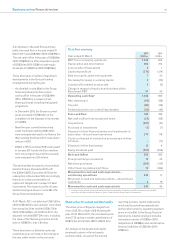
Year ended 31 March
2011
US$m
2010
US$m
Total
growth1
%
Organic
growth1
%
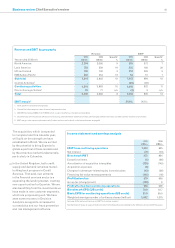
Revenue
Credit Services 225 234 (2) (2)
Decision Analytics 175 175 2 2
Marketing Services 218 212 4 3
Interactive 118 109 10 10
Total – continuing activities 736 730 3 2
Discontinuing activities2 11 62 n/a
Total UK and Ireland 747 792 (4)
EBIT
Continuing activities 213 205 5
Discontinuing activities2 (1) 7 n/a
Total UK and Ireland 212 212 1
EBIT margin328.9% 28.1%
1 Growth at constant exchange rates
2 Discontinuing activities include UK account processing, some UK hosted database activities, UK mortgage software
activities and other smaller discontinuing activities
3 EBIT margin is for continuing business only
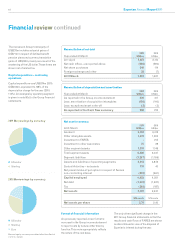
2011 Revenue by activity1
Credit Services 30%
Decision Analytics 24%
Marketing Services 30%
Interactive 16%
1 Excludes discontinuing activities