Experian 2011 Annual Report Download - page 110
Download and view the complete annual report
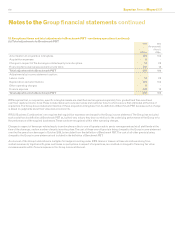
Please find page 110 of the 2011 Experian annual report below. You can navigate through the pages in the report by either clicking on the pages listed below, or by using the keyword search tool below to find specific information within the annual report.-
 1
1 -
2
-
3
-
4
-
5
-
6
-
7
-
8
-
9
-
10
-
11
-
12
-
13
-
14
-
15
-
16
-
17
-
18
-
19
-
20
-
21
-
22
-
23
-
24
-
25
-
26
-
27
-
28
-
29
-
30
-
31
-
32
-
33
-
34
-
35
-
36
-
37
-
38
-
39
-
40
-
41
-
42
-
43
-
44
-
45
-
46
-
47
-
48
-
49
-
50
-
51
-
52
-
53
-
54
-
55
-
56
-
57
-
58
-
59
-
60
-
61
-
62
-
63
-
64
-
65
-
66
-
67
-
68
-
69
-
70
-
71
-
72
-
73
-
74
-
75
-
76
-
77
-
78
-
79
-
80
-
81
-
82
-
83
-
84
-
85
-
86
-
87
-
88
-
89
-
90
-
91
-
92
-
93
-
94
-
95
-
96
-
97
-
98
-
99
-
 100
100 -
 101
101 -
 102
102 -
 103
103 -
 104
104 -
 105
105 -
 106
106 -
 107
107 -
 108
108 -
 109
109 -
 110
110 -
 111
111 -
 112
112 -
 113
113 -
 114
114 -
 115
115 -
 116
116 -
 117
117 -
 118
118 -
 119
119 -
 120
120 -
121
-
122
-
123
-
124
-
125
-
126
-
127
-
128
-
129
-
130
-
131
-
132
-
133
-
134
-
135
-
136
-
137
-
138
-
139
-
140
-
141
-
142
-
143
-
144
-
145
-
146
-
147
-
148
-
149
-
150
-
151
-
152
-
153
-
154
-
155
-
156
-
157
-
158
-
159
-
160
-
161
-
162
-
163
-
164
 |
 |

108 Experian Annual Report 2011
Notes to the Group nancial statements continued
8. Financial risk management (continued)
Liquidity risk
The Group maintains long-term committed facilities to ensure it has sufcient funds available for operations and planned expansions. The
Group monitors rolling forecasts of projected cash ows to ensure that it will have adequate undrawn committed facilities available.
Details of the facilities available to the Group and their utilisation at the balance sheet date are given in note 28. The maturity analysis of
nancial liabilities is given in note 32.
(b) Capital risk management
The Group’s objectives in managing capital are to safeguard its ability to continue as a going concern in order to provide returns for
shareholders and benets for other stakeholders and to maintain an optimal capital structure and cost of capital.
In order to maintain or adjust the capital structure, the Group may adjust the amount of dividends paid to shareholders, return capital to
shareholders, issue or purchase shares or sell assets to reduce net debt. As part of its internal reporting processes the Group monitors capital
employed by operating segment. For this purpose, capital employed is dened as net assets excluding net debt and tax balances. At 31 March
2011 the Group’s capital employed was US$4,453m (2010: US$4,251m). The Group manages its working capital and capital expenditure in order to
meet its target to convert at least 90% of EBIT into operating cash ow and the conversion percentage for the year ended 31 March 2011 was 98%
(2010: 100%).
(c) Fair value estimation
The fair value of derivative nancial instruments and other nancial assets and liabilities is determined by using market data and established
estimation techniques such as discounted cash ow and option valuation models. The fair value of foreign exchange contracts is based
on a comparison of the contractual and year end exchange rates. The fair values of other derivative nancial instruments are estimated by
discounting the future cash ows to net present values using appropriate market rates prevailing at the year end.
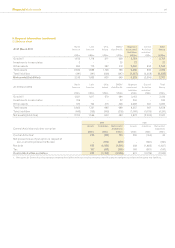
The following table presents an analysis of the Group’s nancial assets and nancial liabilities that are measured at fair value by level, as
required and dened by IFRS 7 ‘Improving disclosures about nancial instruments’:
2011 2010
Level 1
US$m
Level 2
US$m
Level 3
US$m
Total
US$m
Level 1
US$m
Level 2
US$m
Level 3
US$m
Total
US$m
Financial assets:
Loans and receivables - 14 - 14 - 44 - 44
Derivatives used for hedging - 37 - 37 - 43 - 43
Financial assets at fair value
through prot and loss - 8 6 14 - 19 9 28
Available for sale 42 - - 42 33 - - 33
42 59 6 107 33 106 9 148
Financial liabilities:
Derivatives used for hedging - 31 - 31 - 35 - 35
Financial liabilities at fair value
through prot and loss - 33 904 937 - 70 669 739
- 64 904 968 - 105 669 774
Net nancial assets/(liabilities) 42 (5) (898) (861) 33 1 (660) (626)
Assets and liabilities whose valuations are based on unadjusted quoted prices in active markets for identical assets and liabilities are
classied as Level 1 in the above analysis. Assets and liabilities which are not traded in an active market and whose valuations are derived from
available market data that is observable for the asset or liability are classied as Level 2. Assets and liabilities whose valuations are derived
from inputs not based on observable market data are classied as Level 3.
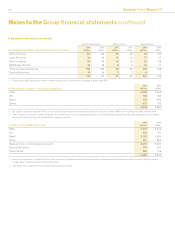
The following table presents an analysis of the changes in nancial assets and liabilities classied as Level 3 which comprise put and call
options associated with corporate transactions:
Year ended 31 March 2011 Year ended 31 March 2010
Serasa put
option
US$m
Other
derivatives
US$m
Total
US$m
Serasa put
option
US$m
Other
derivatives
US$m
Total
US$m
At 1 April (661) 1 (660) (424) - (424)
Additions - (21) (21) - (8) (8)
Valuation gains and losses recognised in income statement (142) (6) (148) (113) 9 (104)
Currency translation gains and losses recognised in other
comprehensive income (67) (2) (69) (124) - (124)
At 31 March (870) (28) (898) (661) 1 (660)