Experian 2011 Annual Report Download - page 133
Download and view the complete annual report
Please find page 133 of the 2011 Experian annual report below. You can navigate through the pages in the report by either clicking on the pages listed below, or by using the keyword search tool below to find specific information within the annual report.-
 1
1 -
2
-
3
-
4
-
5
-
6
-
7
-
8
-
9
-
10
-
11
-
12
-
13
-
14
-
15
-
16
-
17
-
18
-
19
-
20
-
21
-
22
-
23
-
24
-
25
-
26
-
27
-
28
-
29
-
30
-
31
-
32
-
33
-
34
-
35
-
36
-
37
-
38
-
39
-
40
-
41
-
42
-
43
-
44
-
45
-
46
-
47
-
48
-
49
-
50
-
51
-
52
-
53
-
54
-
55
-
56
-
57
-
58
-
59
-
60
-
61
-
62
-
63
-
64
-
65
-
66
-
67
-
68
-
69
-
70
-
71
-
72
-
73
-
74
-
75
-
76
-
77
-
78
-
79
-
80
-
81
-
82
-
83
-
84
-
85
-
86
-
87
-
88
-
89
-
90
-
91
-
92
-
93
-
94
-
95
-
96
-
97
-
98
-
99
-
100
-
101
-
102
-
103
-
104
-
105
-
106
-
107
-
108
-
109
-
110
-
111
-
112
-
113
-
114
-
115
-
116
-
117
-
118
-
119
-
120
-
121
-
122
-
 123
123 -
 124
124 -
 125
125 -
 126
126 -
 127
127 -
 128
128 -
 129
129 -
 130
130 -
 131
131 -
 132
132 -
 133
133 -
 134
134 -
 135
135 -
 136
136 -
 137
137 -
 138
138 -
 139
139 -
 140
140 -
 141
141 -
 142
142 -
 143
143 -
144
-
145
-
146
-
147
-
148
-
149
-
150
-
151
-
152
-
153
-
154
-
155
-
156
-
157
-
158
-
159
-
160
-
161
-
162
-
163
-
164
 |
 |

Financial statements 131
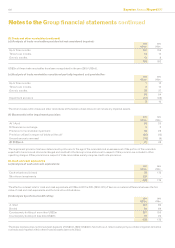
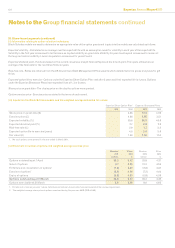
30. Available for sale nancial assets
(a) Analysis of available for sale nancial assets: 2011
US$m
2010
US$m
Listed equity securities - UK (sterling denominated) 36 32
Equity securities - North America (US dollar denominated) - 1
Other trade investments - principally UK and sterling denominated 6 -
42 33
The accounting policies for available for sale nancial assets have been applied to the above items.
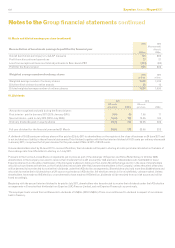
(b) Movements on available for sale nancial assets: 2011
US$m
2010
US$m
At 1 April 33 26
Additions 3 -
Reclassication of held for sale assets 3 -
Net disposals (1) (2)
Fair value gains 4 9
At 31 March 42 33
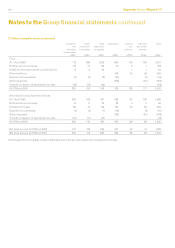
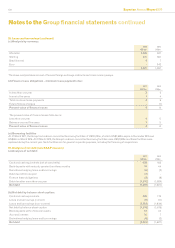
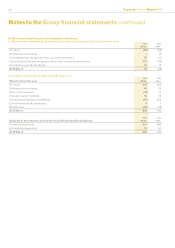
31. Other nancial assets and liabilities
(a) Analysis of other nancial assets and liabilities:
Assets Current
2011
US$m
Non-current
2011
US$m
Current
2010
US$m
Non-current
2010
US$m
Bank deposits 14 - - 44
Derivative nancial instruments:
Fair value hedge of borrowings - interest rate swaps - 37 - 43
Derivatives used for hedging - 37 - 43
Non-hedging derivatives - equity swaps 5 - 16 1
Non-hedging derivatives - interest rate swaps - 2 - -
Non-hedging derivatives - foreign exchange contracts 1 - 2 -
Assets at fair value through prot and loss 6 2 18 1
Derivative nancial instruments 6 39 18 44
Other derivatives - 6 9 -
Total other nancial assets 20 45 27 88
Bank deposits comprise amounts held with an A rated counterparty as collateral against derivative contracts.
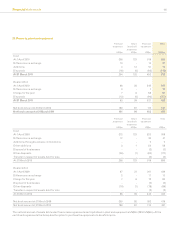
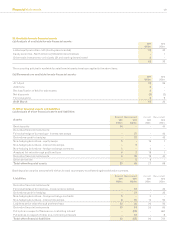
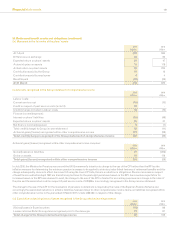
Liabilities Current
2011
US$m
Non-current
2011
US$m
Current
2010
US$m
Non-current
2010
US$m
Derivative nancial instruments:
Fair value hedge of borrowings - cross currency swaps - 31 - 35
Derivatives used for hedging - 31 - 35
Non-hedging derivatives - foreign exchange contracts 5 - 5 -
Non-hedging derivatives - interest rate swaps 8 20 15 50
Liabilities at fair value through prot and loss 13 20 20 50
Derivative nancial instruments 13 51 20 85
Put option in respect of Serasa non-controlling interest - 870 - 661
Put options in respect of other non-controlling interests - 34 - 8
Total other nancial liabilities 13 955 20 754