Experian 2011 Annual Report Download - page 45
Download and view the complete annual report
Please find page 45 of the 2011 Experian annual report below. You can navigate through the pages in the report by either clicking on the pages listed below, or by using the keyword search tool below to find specific information within the annual report.-
 1
1 -
2
-
3
-
4
-
5
-
6
-
7
-
8
-
9
-
10
-
11
-
12
-
13
-
14
-
15
-
16
-
17
-
18
-
19
-
20
-
21
-
22
-
23
-
24
-
25
-
26
-
27
-
28
-
29
-
30
-
31
-
32
-
33
-
34
-
 35
35 -
 36
36 -
 37
37 -
 38
38 -
 39
39 -
 40
40 -
 41
41 -
 42
42 -
 43
43 -
 44
44 -
 45
45 -
 46
46 -
 47
47 -
 48
48 -
 49
49 -
 50
50 -
 51
51 -
 52
52 -
 53
53 -
 54
54 -
 55
55 -
56
-
57
-
58
-
59
-
60
-
61
-
62
-
63
-
64
-
65
-
66
-
67
-
68
-
69
-
70
-
71
-
72
-
73
-
74
-
75
-
76
-
77
-
78
-
79
-
80
-
81
-
82
-
83
-
84
-
85
-
86
-
87
-
88
-
89
-
90
-
91
-
92
-
93
-
94
-
95
-
96
-
97
-
98
-
99
-
100
-
101
-
102
-
103
-
104
-
105
-
106
-
107
-
108
-
109
-
110
-
111
-
112
-
113
-
114
-
115
-
116
-
117
-
118
-
119
-
120
-
121
-
122
-
123
-
124
-
125
-
126
-
127
-
128
-
129
-
130
-
131
-
132
-
133
-
134
-
135
-
136
-
137
-
138
-
139
-
140
-
141
-
142
-
143
-
144
-
145
-
146
-
147
-
148
-
149
-
150
-
151
-
152
-
153
-
154
-
155
-
156
-
157
-
158
-
159
-
160
-
161
-
162
-
163
-
164
 |
 |

Business review Financial review 43
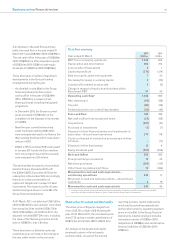
As indicated in the cash flow summary
table, free cash flow in the year ended 31
March 2011 was US$792m (2010: US$799m).
The net cash inflow in the year of US$508m
(2010: US$590m) is after acquisition spend
of US$301m (2010: US$41m) and equity
dividends of US$251m (2010: US$206m).
There have been a number of significant
developments in the Group’s funding
arrangements during the year:
•As detailed in note 39(e) to the Group
financial statements, there was a
cash outflow in the year of US$349m
(2010: US$114m) in respect of net
share purchases including the buyback
programme.
•In December 2010, the Group received
gross proceeds of US$314m on the
completion of the disposal of its interest
in FARES.
•New five-year committed revolving
credit facilities totalling US$1,700m
were arranged and used to re-finance the
then existing facilities which were due to
mature in 2012.
•£400m 4.75% Euronotes 2018 were issued
in January 2011 under the Euro medium
term note programme and the proceeds
were swapped into US dollars.
The earliest date of maturity of committed
bank facilities is December 2015 with
the £334m 5.625% Euronotes 2013 due for
redemption in December 2013. Accordingly,
there is no undue concentration of
repayment obligations in respect of debt
instruments. The maturity profile of loans
and borrowings is shown in note 28 to the
Group financial statements.
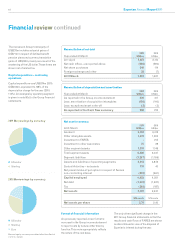
At 31 March 2011, net debt was US$1,501m
(2010: US$1,627m) and undrawn committed
borrowing facilities totalled US$1,700m
(2010: US$1,932m). At 31 March 2011, the
adjusted net debt/EBITDA ratio, including
the value of the Serasa put option at that
date of US$870m, was 1.8 times.
There have been no defaults under any
covenants given on loans or borrowings in
the year under review or the prior year.
Share price, net assets and total equity
The share price of Experian ranged from
a low of £5.72 to a high of £8.19 during the
year. On 31 March 2011, the mid market price
was £7.72, giving a market capitalisation of
US$12.7bn at that date (2010: US$10.1bn).
An analysis of net assets and capital
employed is given in the net assets
summary table. As part of the internal
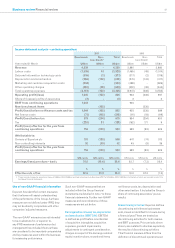
Cash flow summary
Year ended 31 March 2011
US$m 2010
US$m
EBIT from continuing operations 1,044 935
Depreciation and amortisation 288 274
Loss on sale of fixed assets 51
Capital expenditure (374) (314)
Sale of property, plant and equipment 730
Decrease/(increase) in working capital 4(22)
Loss/(profit) retained in associate 3(2)
Charge in respect of equity incentive plans within
Benchmark PBT 51 33
Operating cash flow11,028 935
Net interest paid (92) (68)
Tax paid (88) (26)
Dividends paid to non-controlling interests (56) (42)
Free cash flow 792 799
Net cash outflow from exceptional items (20) (62)
Acquisitions (301) (41)
Purchase of investments (3) (7)
Disposal of other financial assets and investments in
associates – discontinued operations 279 118
Costs on disposal of transaction processing activities
in France -(17)
Disposal of other businesses 12 6
Equity dividends paid (251) (206)
Net cash inflow 508 590
Foreign exchange movements 12 35
Net share purchases (349) (114)
Other financing related cash flows 72 (494)
Movement in cash and cash equivalents –
continuing operations 243 17
Movement in cash and cash equivalents – discontinued
operations 219
Movement in cash and cash equivalents 245 36
1. A reconciliation of cash generated from operations as reported in the Group cash flow statement on page 96 to
operating cash flow as reported above is given in note 39 to the Group financial statements.
reporting process, capital employed is
monitored by operating segment and
further information by operating segment
given in note 9(b) to the Group financial
statements. Capital employed includes
net pension assets of US$55m (2010:
obligations of US$88m) and net derivative
financial liabilities of US$13m (2010:
US$34m).