Experian 2011 Annual Report Download - page 108
Download and view the complete annual report
Please find page 108 of the 2011 Experian annual report below. You can navigate through the pages in the report by either clicking on the pages listed below, or by using the keyword search tool below to find specific information within the annual report.-
 1
1 -
2
-
3
-
4
-
5
-
6
-
7
-
8
-
9
-
10
-
11
-
12
-
13
-
14
-
15
-
16
-
17
-
18
-
19
-
20
-
21
-
22
-
23
-
24
-
25
-
26
-
27
-
28
-
29
-
30
-
31
-
32
-
33
-
34
-
35
-
36
-
37
-
38
-
39
-
40
-
41
-
42
-
43
-
44
-
45
-
46
-
47
-
48
-
49
-
50
-
51
-
52
-
53
-
54
-
55
-
56
-
57
-
58
-
59
-
60
-
61
-
62
-
63
-
64
-
65
-
66
-
67
-
68
-
69
-
70
-
71
-
72
-
73
-
74
-
75
-
76
-
77
-
78
-
79
-
80
-
81
-
82
-
83
-
84
-
85
-
86
-
87
-
88
-
89
-
90
-
91
-
92
-
93
-
94
-
95
-
96
-
97
-
 98
98 -
 99
99 -
 100
100 -
 101
101 -
 102
102 -
 103
103 -
 104
104 -
 105
105 -
 106
106 -
 107
107 -
 108
108 -
 109
109 -
 110
110 -
 111
111 -
 112
112 -
 113
113 -
 114
114 -
 115
115 -
 116
116 -
 117
117 -
 118
118 -
119
-
120
-
121
-
122
-
123
-
124
-
125
-
126
-
127
-
128
-
129
-
130
-
131
-
132
-
133
-
134
-
135
-
136
-
137
-
138
-
139
-
140
-
141
-
142
-
143
-
144
-
145
-
146
-
147
-
148
-
149
-
150
-
151
-
152
-
153
-
154
-
155
-
156
-
157
-
158
-
159
-
160
-
161
-
162
-
163
-
164
 |
 |

106 Experian Annual Report 2011
Notes to the Group nancial statements continued
7. Use of non-GAAP measures in the Group nancial statements (continued)
Earnings before interest and tax (‘EBIT’)
EBIT is dened as prot before amortisation of acquisition intangibles, acquisition expenses, goodwill impairments, adjustments to contingent
consideration, charges in respect of the demerger-related equity incentive plans, exceptional items, net nance costs, tax and discontinued
operations. It includes the Group’s share of continuing associates’ pre-tax results.
Benchmark earnings
Benchmark earnings represents Benchmark PBT less attributable tax and non-controlling interests. Benchmark earnings attributable to non-
controlling interests represents that portion of Benchmark earnings that relate to non-controlling interests. Benchmark PBT less attributable
tax is designated as overall benchmark earnings. The attributable tax for the purposes of determining benchmark earnings excludes signicant
tax credits and charges arising in the year which, in view of their size or nature, are not comparable with previous periods together with tax
arising on exceptional items and on total adjustments to Benchmark PBT.
Benchmark earnings per share (‘Benchmark EPS’)
Benchmark EPS represents Benchmark earnings divided by a weighted average number of shares, and is disclosed to indicate the underlying
protability of the Group.
Exceptional items
The separate reporting of non-recurring exceptional items gives an indication of the Group’s underlying performance. Exceptional items are
those arising from the prot or loss on disposal of businesses, closure costs of major business units or costs of signicant restructuring
programmes. All other restructuring costs are charged against EBIT in the segments in which they are incurred.
Operating cash ow
Operating cash ow is calculated as cash generated from operations adjusted for outows in respect of the purchase of property, plant and
equipment and other intangible assets and adding dividends from continuing associates but excluding any cash inows and outows in respect
of exceptional items. It is dened as EBIT less changes in working capital, plus depreciation/amortisation, less capital expenditure, less prot or
loss retained in continuing associates.
Net debt
Net debt is calculated as total debt less cash and cash equivalents and other highly liquid bank deposits with original maturities greater
than three months. Total debt includes loans and borrowings (and the fair value of derivatives hedging loans and borrowings), overdrafts and
obligations under nance leases. Accrued interest is excluded from net debt.
8. Financial risk management
(a) Financial risk factors
The Group’s activities expose it to a variety of nancial risks: market risk (including foreign exchange risk, interest rate risk and price risk),
credit risk and liquidity risk. The Group’s nancial risk management focuses on the unpredictability of nancial markets and seeks to minimise
potentially adverse effects on the Group’s nancial performance. The Group seeks to reduce its exposure to nancial risks and uses derivative
nancial instruments to hedge certain risk exposures. The Group also ensures surplus funds are managed and controlled in a prudent manner
which will protect capital sums invested and ensure adequate short-term liquidity, whilst maximising returns.
Market risk
Foreign exchange risk
The Group operates internationally and is exposed to foreign exchange risk from future commercial transactions, recognised assets and
liabilities and investments in, and loans between, undertakings with different functional currencies. The Group manages such risk, primarily
within undertakings whose functional currencies are the US dollar, by borrowing in the relevant currencies and using forward foreign exchange
contracts. The principal transaction exposures in 2011 were to sterling and the euro.
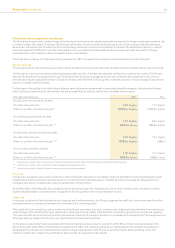
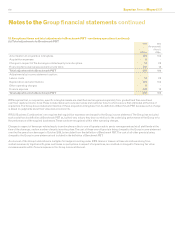
On the basis of the prole of foreign exchange transaction exposures, and an assessment of reasonably possible changes in such exposures, the
Group’s sensitivity to foreign exchange risk can be quantied as follows, with all other variables held constant:
Foreign exchange exposure 2011 2010
Sterling against US dollar:
Currency strengthening/weakening 10% 10%
Effect on prot for the nancial year US$1m higher/lower US$60m higher/ lower
Effect on other comprehensive income and other components of equity US$nil US$nil
Euro against US dollar:
Currency strengthening/weakening 10% 10%
Effect on prot for the nancial year US$nil US$7m higher/lower
Effect on other comprehensive income and other components of equity US$nil US$nil