Experian 2011 Annual Report Download - page 123
Download and view the complete annual report
Please find page 123 of the 2011 Experian annual report below. You can navigate through the pages in the report by either clicking on the pages listed below, or by using the keyword search tool below to find specific information within the annual report.-
 1
1 -
2
-
3
-
4
-
5
-
6
-
7
-
8
-
9
-
10
-
11
-
12
-
13
-
14
-
15
-
16
-
17
-
18
-
19
-
20
-
21
-
22
-
23
-
24
-
25
-
26
-
27
-
28
-
29
-
30
-
31
-
32
-
33
-
34
-
35
-
36
-
37
-
38
-
39
-
40
-
41
-
42
-
43
-
44
-
45
-
46
-
47
-
48
-
49
-
50
-
51
-
52
-
53
-
54
-
55
-
56
-
57
-
58
-
59
-
60
-
61
-
62
-
63
-
64
-
65
-
66
-
67
-
68
-
69
-
70
-
71
-
72
-
73
-
74
-
75
-
76
-
77
-
78
-
79
-
80
-
81
-
82
-
83
-
84
-
85
-
86
-
87
-
88
-
89
-
90
-
91
-
92
-
93
-
94
-
95
-
96
-
97
-
98
-
99
-
100
-
101
-
102
-
103
-
104
-
105
-
106
-
107
-
108
-
109
-
110
-
111
-
112
-
 113
113 -
 114
114 -
 115
115 -
 116
116 -
 117
117 -
 118
118 -
 119
119 -
 120
120 -
 121
121 -
 122
122 -
 123
123 -
 124
124 -
 125
125 -
 126
126 -
 127
127 -
 128
128 -
 129
129 -
 130
130 -
 131
131 -
 132
132 -
 133
133 -
134
-
135
-
136
-
137
-
138
-
139
-
140
-
141
-
142
-
143
-
144
-
145
-
146
-
147
-
148
-
149
-
150
-
151
-
152
-
153
-
154
-
155
-
156
-
157
-
158
-
159
-
160
-
161
-
162
-
163
-
164
 |
 |

Financial statements 121
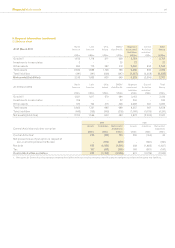
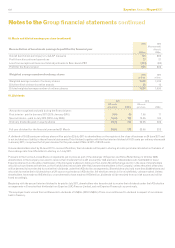
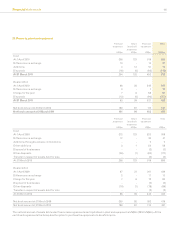
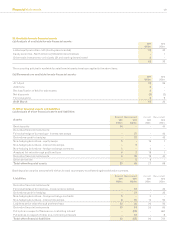
18. Basic and diluted earnings per share
Basic earnings per share is calculated by dividing the earnings attributable to ordinary shareholders of the Company by a weighted average
number of ordinary shares (being the ordinary shares in issue during the year less own shares held in Treasury and in employee trusts, which are
treated as cancelled).
The calculation of diluted earnings per share reects the potentially dilutive effect of employee share incentive plans. The earnings gures used
in the calculations are unchanged for diluted earnings per share.
Basic earnings per share
2011
US cents
2010
(Re-presented)
(Note 3)
US cents
Continuing and discontinued operations 57.9 59.0
Discontinued operations (7.3) (2.6)
Continuing operations 50.6 56.4
Exceptional items and total adjustments to Benchmark PBT, net of tax 19.4 7.3
Benchmark earnings per share from continuing operations (non-GAAP measure) 70.0 63.7
Diluted earnings per share
2011
US cents
2010
(Re-presented)
(Note 3)
US cents
Continuing and discontinued operations 56.7 58.1
Discontinued operations (7.2) (2.6)
Continuing operations 49.5 55.5
Exceptional items and total adjustments to Benchmark PBT, net of tax 19.0 7.3
Benchmark diluted earnings per share from continuing operations (non-GAAP measure) 68.5 62.8
Earnings attributable to owners of Experian plc
2011
US$m
2010
(Re-presented)
(Note 3)
US$m
Continuing and discontinued operations 581 600
Discontinued operations (73) (27)
Continuing operations 508 573
Exceptional items and total adjustments to Benchmark PBT, net of tax 193 74
Benchmark earnings attributable to owners of Experian plc (non-GAAP measure) 701 647
Earnings attributable to non-controlling interests 2011
US$m
2010
US$m
Continuing and discontinued operations 42 36
Amortisation of acquisition intangibles attributable to non-controlling interests, net of tax 10 9
Benchmark earnings attributable to non-controlling interests (non-GAAP measure) 52 45