Experian 2011 Annual Report Download - page 7
Download and view the complete annual report
Please find page 7 of the 2011 Experian annual report below. You can navigate through the pages in the report by either clicking on the pages listed below, or by using the keyword search tool below to find specific information within the annual report.-
 1
1 -
 2
2 -
 3
3 -
 4
4 -
 5
5 -
 6
6 -
 7
7 -
 8
8 -
 9
9 -
 10
10 -
 11
11 -
 12
12 -
 13
13 -
 14
14 -
 15
15 -
 16
16 -
 17
17 -
 18
18 -
19
-
20
-
21
-
22
-
23
-
24
-
25
-
26
-
27
-
28
-
29
-
30
-
31
-
32
-
33
-
34
-
35
-
36
-
37
-
38
-
39
-
40
-
41
-
42
-
43
-
44
-
45
-
46
-
47
-
48
-
49
-
50
-
51
-
52
-
53
-
54
-
55
-
56
-
57
-
58
-
59
-
60
-
61
-
62
-
63
-
64
-
65
-
66
-
67
-
68
-
69
-
70
-
71
-
72
-
73
-
74
-
75
-
76
-
77
-
78
-
79
-
80
-
81
-
82
-
83
-
84
-
85
-
86
-
87
-
88
-
89
-
90
-
91
-
92
-
93
-
94
-
95
-
96
-
97
-
98
-
99
-
100
-
101
-
102
-
103
-
104
-
105
-
106
-
107
-
108
-
109
-
110
-
111
-
112
-
113
-
114
-
115
-
116
-
117
-
118
-
119
-
120
-
121
-
122
-
123
-
124
-
125
-
126
-
127
-
128
-
129
-
130
-
131
-
132
-
133
-
134
-
135
-
136
-
137
-
138
-
139
-
140
-
141
-
142
-
143
-
144
-
145
-
146
-
147
-
148
-
149
-
150
-
151
-
152
-
153
-
154
-
155
-
156
-
157
-
158
-
159
-
160
-
161
-
162
-
163
-
164
 |
 |
Introduction Business and market overview xx
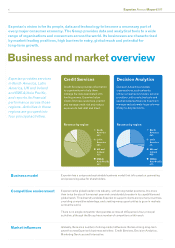
5
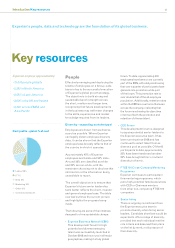
Revenue by industry
Revenue by region
North
America
54%
Latin
America
17%
UK and
Ireland
17%
EMEA/
Asia Pacific
12%
Revenue by activity
Credit
Services
43%
Decision
Analytics
10%
Marketing
Services
19%
Interactive
28%
Revenue by client
Top 10
clients
10%
Top 50
clients
23%
All other
77%
Financial
services 33%
Direct-to-
consumer 20%
Retail 15%
Public sector
and education
6%
Automotive
5%
Insurance 4%
Telecoms and
utilities 4%
Other 13%
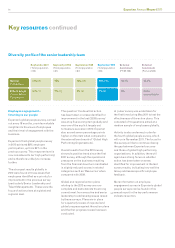
Source: Latest full-year revenue,
company SEC filings
1 Year ended 31 March 2011
2 Year ended 31 December 2010
3 Year ended 31 March 2010
4 Year ended 30 September 2010
* US only
International
North America
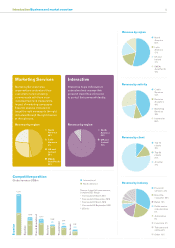
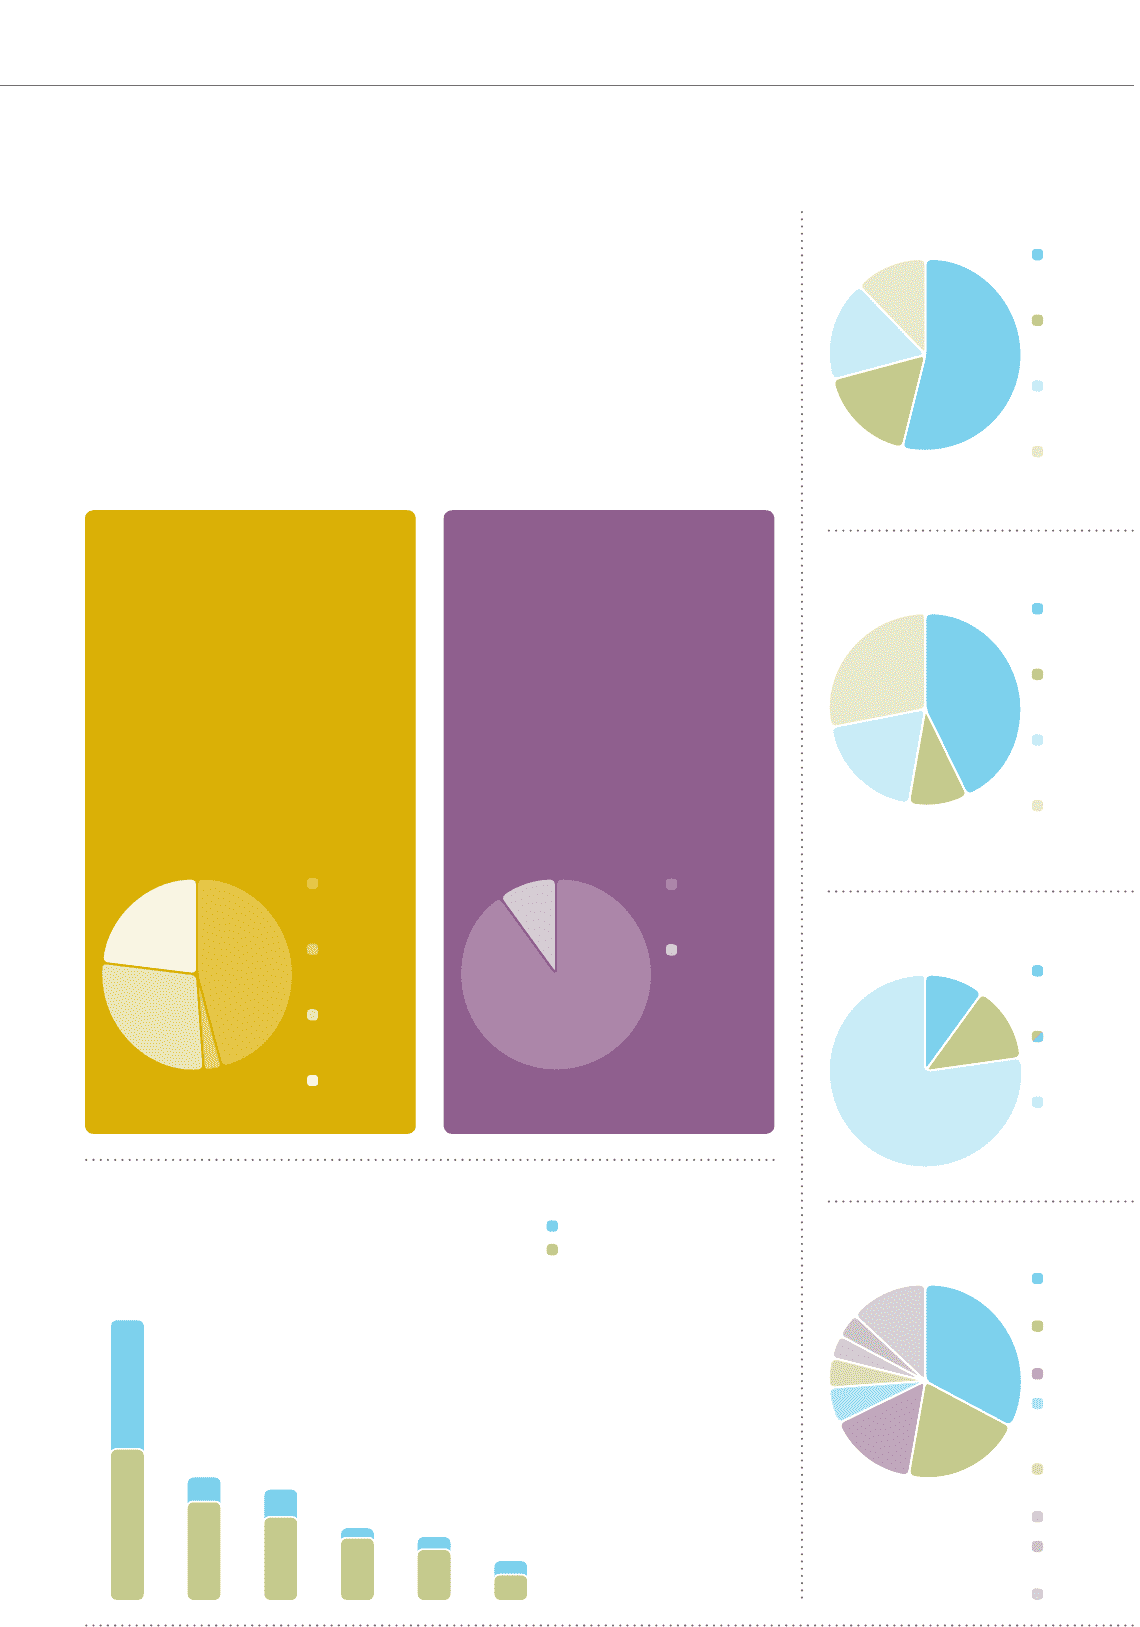
Interactive
Interactive helps individuals to
understand and manage their
personal credit files online and
to protect their personal identity.
North
America
90%
UK and
Ireland
10%
Revenue by region
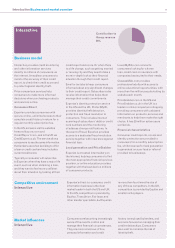
Competitive position
Global revenue US$m
54%
Experian
Equifax
Acxiom
Dun & Bradstreet
TransUnion
Fair Isaac
46%
54%
4,214
1
1,860
2
80%
20%
1,677
2
25%
75%
1,099
3
14%
86*
86%*
966
2
20%
65%*
606
4
35%
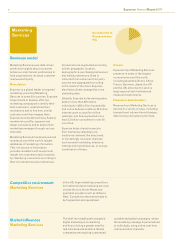
Marketing Services
Marketing Services helps
organisations understand their
customers more completely,
communicate with them on an
individual level and measure the
impact of marketing campaigns.
Experian enables marketers to
target the right message to the right
individual through the right channel
at the right time.
North
America
46%
Latin
America
3%
UK and
Ireland
28%
EMEA/
Asia Pacific
23%
Revenue by region