Experian 2011 Annual Report Download - page 27
Download and view the complete annual report
Please find page 27 of the 2011 Experian annual report below. You can navigate through the pages in the report by either clicking on the pages listed below, or by using the keyword search tool below to find specific information within the annual report.-
 1
1 -
2
-
3
-
4
-
5
-
6
-
7
-
8
-
9
-
10
-
11
-
12
-
13
-
14
-
15
-
16
-
 17
17 -
 18
18 -
 19
19 -
 20
20 -
 21
21 -
 22
22 -
 23
23 -
 24
24 -
 25
25 -
 26
26 -
 27
27 -
 28
28 -
 29
29 -
 30
30 -
 31
31 -
 32
32 -
 33
33 -
 34
34 -
 35
35 -
 36
36 -
 37
37 -
38
-
39
-
40
-
41
-
42
-
43
-
44
-
45
-
46
-
47
-
48
-
49
-
50
-
51
-
52
-
53
-
54
-
55
-
56
-
57
-
58
-
59
-
60
-
61
-
62
-
63
-
64
-
65
-
66
-
67
-
68
-
69
-
70
-
71
-
72
-
73
-
74
-
75
-
76
-
77
-
78
-
79
-
80
-
81
-
82
-
83
-
84
-
85
-
86
-
87
-
88
-
89
-
90
-
91
-
92
-
93
-
94
-
95
-
96
-
97
-
98
-
99
-
100
-
101
-
102
-
103
-
104
-
105
-
106
-
107
-
108
-
109
-
110
-
111
-
112
-
113
-
114
-
115
-
116
-
117
-
118
-
119
-
120
-
121
-
122
-
123
-
124
-
125
-
126
-
127
-
128
-
129
-
130
-
131
-
132
-
133
-
134
-
135
-
136
-
137
-
138
-
139
-
140
-
141
-
142
-
143
-
144
-
145
-
146
-
147
-
148
-
149
-
150
-
151
-
152
-
153
-
154
-
155
-
156
-
157
-
158
-
159
-
160
-
161
-
162
-
163
-
164
 |
 |

Business review Chief Executive’s review 25
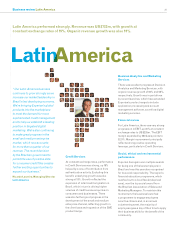
The acquisition, which is expected
to complete later this calendar year,
will build on the strength we have
established in Brazil. We are excited
by the potential to bring Experian’s
global expertise to these markets and
by the attractive market fundamentals,
particularly in Colombia.
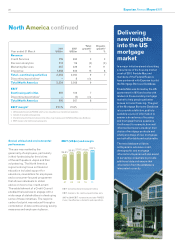
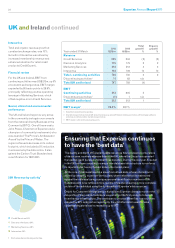
In the United Kingdom, both credit
supply and demand remained muted,
holding back progress in Credit
Services. That said, new entrants
in the nancial services sector are
expanding the lending market, creating
new opportunities for Experian. We are
also beneting from the investments we
have made in new customer segments,
which are progressing well. We have
seen some recovery in Decision
Analytics as appetite increases for
our analytics and our fraud prevention
and risk management software.
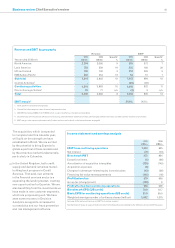
Revenue and EBIT by geography
Revenue EBIT3
Year ended 31 March 2011
US$m
2010
US$m
Growth1
%
2011
US$m
2010
US$m
Growth1
%
North America 2,254 2,060 9 610 572 7
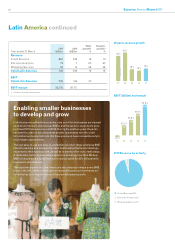
Latin America 722 559 19 235 166 30
UK and Ireland 736 730 3 213 205 5
EMEA/Asia Pacic 502 454 12 54 51 7
Sub total 4,214 3,803 10 1,112 994 10
Central Activities2-- - (66) (62)
Continuing activities 4,214 3,803 10 1,046 932 11
Discontinuing activities425 77 n/a (2) 3 n/a
Total 4,239 3,880 8 1,044 935 10
EBIT margin524.8% 24.5%
1. Total growth at constant exchange rates
2. Central Activities comprise costs of central corporate functions
3. 2010 EBIT excludes US$56m from FARES (which is now classied as a discontinued operation)
4. Discontinuing activities include UK account processing, some UK hosted database activities, UK mortgage software activities and other smaller discontinuing activities
5. EBIT margin is for continuing business only. Further analysis can be found in the nancial review on page 48
Income statement and earnings analysis
2011
US$m
2010
US$m
EBIT from continuing operations 1,044 935
Net interest (71) (81)
Benchmark PBT 973 854
Exceptional items (2) (68)
Amortisation of acquisition intangibles (129) (140)
Acquisition expenses (8) -
Charges for demerger-related equity incentive plans (13) (28)
Financing fair value remeasurements (142) (18)
Prot before tax 679 600
Group tax (charge)/credit (129) 9
Prot after tax from continuing operations 550 609
Benchmark EPS (US cents) 70.0 63.7
Basic EPS for continuing operations (US cents) 57.9 59.0
Weighted average number of ordinary shares (million) 1,002 1,015
See page 48 for analysis of revenue and EBIT by business segment
See the nancial review on pages 47 to 49, and note 7 to the Group nancial statements for denitions of non-GAAP measures
33