Experian 2011 Annual Report Download - page 128
Download and view the complete annual report
Please find page 128 of the 2011 Experian annual report below. You can navigate through the pages in the report by either clicking on the pages listed below, or by using the keyword search tool below to find specific information within the annual report.-
 1
1 -
2
-
3
-
4
-
5
-
6
-
7
-
8
-
9
-
10
-
11
-
12
-
13
-
14
-
15
-
16
-
17
-
18
-
19
-
20
-
21
-
22
-
23
-
24
-
25
-
26
-
27
-
28
-
29
-
30
-
31
-
32
-
33
-
34
-
35
-
36
-
37
-
38
-
39
-
40
-
41
-
42
-
43
-
44
-
45
-
46
-
47
-
48
-
49
-
50
-
51
-
52
-
53
-
54
-
55
-
56
-
57
-
58
-
59
-
60
-
61
-
62
-
63
-
64
-
65
-
66
-
67
-
68
-
69
-
70
-
71
-
72
-
73
-
74
-
75
-
76
-
77
-
78
-
79
-
80
-
81
-
82
-
83
-
84
-
85
-
86
-
87
-
88
-
89
-
90
-
91
-
92
-
93
-
94
-
95
-
96
-
97
-
98
-
99
-
100
-
101
-
102
-
103
-
104
-
105
-
106
-
107
-
108
-
109
-
110
-
111
-
112
-
113
-
114
-
115
-
116
-
117
-
 118
118 -
 119
119 -
 120
120 -
 121
121 -
 122
122 -
 123
123 -
 124
124 -
 125
125 -
 126
126 -
 127
127 -
 128
128 -
 129
129 -
 130
130 -
 131
131 -
 132
132 -
 133
133 -
 134
134 -
 135
135 -
 136
136 -
 137
137 -
 138
138 -
139
-
140
-
141
-
142
-
143
-
144
-
145
-
146
-
147
-
148
-
149
-
150
-
151
-
152
-
153
-
154
-
155
-
156
-
157
-
158
-
159
-
160
-
161
-
162
-
163
-
164
 |
 |

126 Experian Annual Report 2011
Notes to the Group nancial statements continued
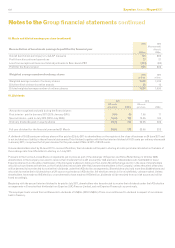
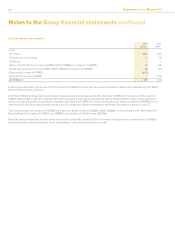
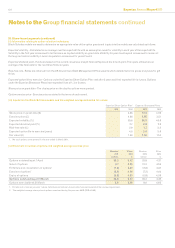
23. Investments in associates
2011
US$m
2010
US$m
Cost
At 1 April 243 332
Differences on exchange 1 (1)
Additions - 7
Share of prot after tax (including US$5m (2010: US$56m) in respect of FARES) 3 58
Dividends received (including US$2m (2010: US$41m) in respect of FARES) (3) (41)
Disposal of interest in FARES (217) -
Disposal of assets by FARES - (112)
At 31 March 27 243
Following the disposal by the Group of its 20% holding of FARES during the year, the Group’s interests in associated undertakings at 31 March
2011 are not individually material.
At 31 March 2010, the Group’s principal interest in associated undertakings was the 20% holding of FARES with the balance of the capital of
FARES held by FAC. In the year ended 31 March 2011, pursuant to the notice received from FAC on 22 April 2010 in respect of the exercise of
its buy-out option, Experian completed the disposal of its interest in FARES. The results of and gains and losses in respect of FARES are now
reported within results for discontinued operations with comparative gures re-presented and further information is shown in note 17.
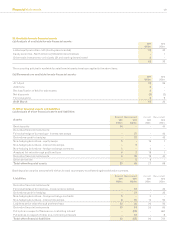
The Group’s share of the revenue of FARES in the period to 22 April 2010 was US$22m (2010: US$263m for the full year). At 31 March 2010 the
Group’s share of the assets of FARES was US$383m and its share of liabilities was US$176m.
Since the balance sheet date, the Group has purchased a further 40% interest in DP Information in Singapore for a consideration of US$23m
and it now holds a controlling interest in this undertaking. Further details are given in note 46.