Experian 2011 Annual Report Download - page 113
Download and view the complete annual report
Please find page 113 of the 2011 Experian annual report below. You can navigate through the pages in the report by either clicking on the pages listed below, or by using the keyword search tool below to find specific information within the annual report.-
 1
1 -
2
-
3
-
4
-
5
-
6
-
7
-
8
-
9
-
10
-
11
-
12
-
13
-
14
-
15
-
16
-
17
-
18
-
19
-
20
-
21
-
22
-
23
-
24
-
25
-
26
-
27
-
28
-
29
-
30
-
31
-
32
-
33
-
34
-
35
-
36
-
37
-
38
-
39
-
40
-
41
-
42
-
43
-
44
-
45
-
46
-
47
-
48
-
49
-
50
-
51
-
52
-
53
-
54
-
55
-
56
-
57
-
58
-
59
-
60
-
61
-
62
-
63
-
64
-
65
-
66
-
67
-
68
-
69
-
70
-
71
-
72
-
73
-
74
-
75
-
76
-
77
-
78
-
79
-
80
-
81
-
82
-
83
-
84
-
85
-
86
-
87
-
88
-
89
-
90
-
91
-
92
-
93
-
94
-
95
-
96
-
97
-
98
-
99
-
100
-
101
-
102
-
 103
103 -
 104
104 -
 105
105 -
 106
106 -
 107
107 -
 108
108 -
 109
109 -
 110
110 -
 111
111 -
 112
112 -
 113
113 -
 114
114 -
 115
115 -
 116
116 -
 117
117 -
 118
118 -
 119
119 -
 120
120 -
 121
121 -
 122
122 -
 123
123 -
124
-
125
-
126
-
127
-
128
-
129
-
130
-
131
-
132
-
133
-
134
-
135
-
136
-
137
-
138
-
139
-
140
-
141
-
142
-
143
-
144
-
145
-
146
-
147
-
148
-
149
-
150
-
151
-
152
-
153
-
154
-
155
-
156
-
157
-
158
-
159
-
160
-
161
-
162
-
163
-
164
 |
 |
Financial statements 111
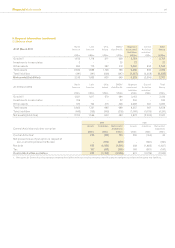
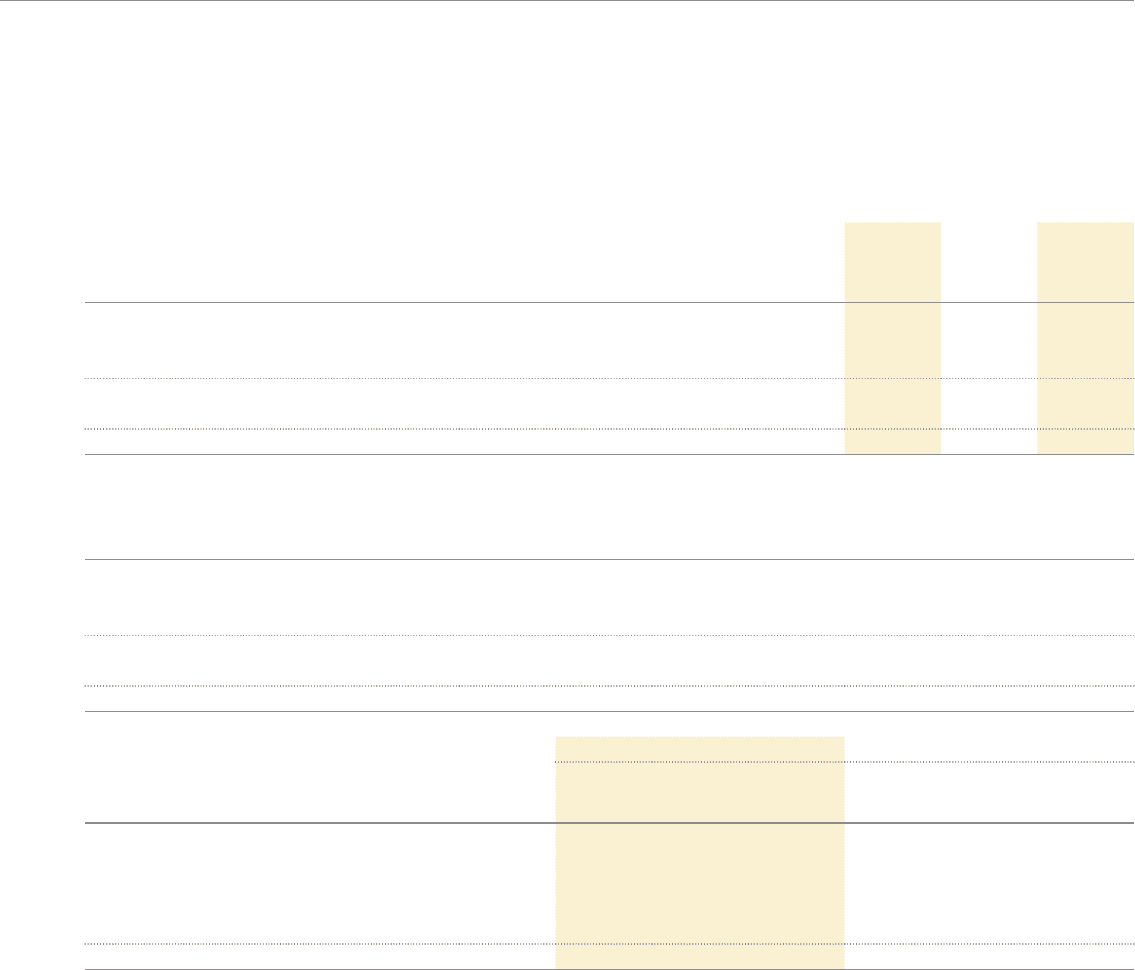
9. Segment information (continued)
(ii) Balance sheet
At 31 March 2011 North
America
US$m
Latin
America
US$m
UK &
Ireland
US$m
EMEA/
Asia Pacic
US$m
Segment
assets and
liabilities
US$m
Central
Activities
and other1
US$m
Total
Group
US$m
Goodwill 1,675 1,116 611 359 3,761 - 3,761
Investments in associates 2 - - 25 27 - 27
Other assets 953 770 557 412 2,692 852 3,544
Total assets 2,630 1,886 1,168 796 6,480 852 7,332
Total liabilities (491) (191) (338) (247) (1,267) (3,358) (4,625)
Net assets/(liabilities) 2,139 1,695 830 549 5,213 (2,506) 2,707
At 31 March 2010 North
America
US$m
Latin
America
US$m
UK &
Ireland
US$m
EMEA/
Asia Pacic
US$m
Segment
assets and
liabilities
US$m
Central
Activities
and other1
US$m
Total
Group
US$m
Goodwill 1,531 1,017 570 294 3,412 - 3,412
Investments in associates 216 - - 27 243 - 243
Other assets 915 704 415 348 2,382 641 3,023
Total assets 2,662 1,721 985 669 6,037 641 6,678
Total liabilities (449) (155) (345) (216) (1,165) (3,076) (4,241)
Net assets/(liabilities) 2,213 1,566 640 453 4,872 (2,435) 2,437
2011 2010
Central Activities and other comprise: Assets
US$m
Liabilities
US$m
Net assets/
(liabilities)
US$m
Assets
US$m
Liabilities
US$m
Net assets/
(liabilities)
US$m
Central Activities1230 (120) 110 203 (163) 40
Net present value of put option in respect of
non-controlling interest in Serasa - (870) (870) - (661) (661)
Net debt 455 (1,956) (1,501) 258 (1,885) (1,627)
Tax 167 (412) (245) 180 (367) (187)
Central Activities and other 852 (3,358) (2,506) 641 (3,076) (2,435)
1. Net assets for Central Activities comprise corporate head ofce balances including retirement benet assets and obligations and derivative assets and liabilities.