Experian 2011 Annual Report Download - page 126
Download and view the complete annual report
Please find page 126 of the 2011 Experian annual report below. You can navigate through the pages in the report by either clicking on the pages listed below, or by using the keyword search tool below to find specific information within the annual report.-
 1
1 -
2
-
3
-
4
-
5
-
6
-
7
-
8
-
9
-
10
-
11
-
12
-
13
-
14
-
15
-
16
-
17
-
18
-
19
-
20
-
21
-
22
-
23
-
24
-
25
-
26
-
27
-
28
-
29
-
30
-
31
-
32
-
33
-
34
-
35
-
36
-
37
-
38
-
39
-
40
-
41
-
42
-
43
-
44
-
45
-
46
-
47
-
48
-
49
-
50
-
51
-
52
-
53
-
54
-
55
-
56
-
57
-
58
-
59
-
60
-
61
-
62
-
63
-
64
-
65
-
66
-
67
-
68
-
69
-
70
-
71
-
72
-
73
-
74
-
75
-
76
-
77
-
78
-
79
-
80
-
81
-
82
-
83
-
84
-
85
-
86
-
87
-
88
-
89
-
90
-
91
-
92
-
93
-
94
-
95
-
96
-
97
-
98
-
99
-
100
-
101
-
102
-
103
-
104
-
105
-
106
-
107
-
108
-
109
-
110
-
111
-
112
-
113
-
114
-
115
-
 116
116 -
 117
117 -
 118
118 -
 119
119 -
 120
120 -
 121
121 -
 122
122 -
 123
123 -
 124
124 -
 125
125 -
 126
126 -
 127
127 -
 128
128 -
 129
129 -
 130
130 -
 131
131 -
 132
132 -
 133
133 -
 134
134 -
 135
135 -
 136
136 -
137
-
138
-
139
-
140
-
141
-
142
-
143
-
144
-
145
-
146
-
147
-
148
-
149
-
150
-
151
-
152
-
153
-
154
-
155
-
156
-
157
-
158
-
159
-
160
-
161
-
162
-
163
-
164
 |
 |

124 Experian Annual Report 2011
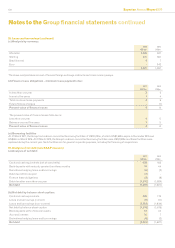
Notes to the Group nancial statements continued
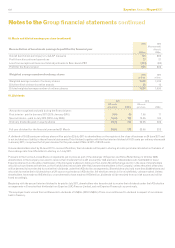
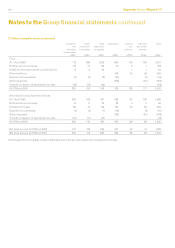
21. Other intangible assets (continued)
Customer
and
advertiser
relationships
US$m
Other
acquisition
intangibles
US$m
Total
acquisition
intangibles
US$m
Databases
US$m
Internal
use
software
US$m
Internally
generated
software
US$m
Total
US$m
Cost
At 1 April 2009 776 286 1,062 855 145 195 2,257
Differences on exchange 82 47 129 57 6 7 199
Additions through business combinations 14 6 20 - 1 1 22
Other additions - - - 168 43 45 256
Disposal of businesses (5) (3) (8) (34) - (4) (46)
Other disposals - - - (128) - (67) (195)
Transfer in respect of assets held for sale (42) (18) (60) - - - (60)
At 31 March 2010 825 318 1,143 918 195 177 2,433
Amortisation and impairment losses
At 1 April 2009 259 108 367 498 83 120 1,068
Differences on exchange 14 11 25 29 4 5 63
Charge for the year 96 44 140 142 22 25 329
Disposal of businesses (4) (3) (7) (16) - (4) (27)
Other disposals - - - (128) - (61) (189)
Transfer in respect of assets held for sale (27) (17) (44) - - - (44)
At 31 March 2010 338 143 481 525 109 85 1,200
Net book amount at 31 March 2009 517 178 695 357 62 75 1,189
Net book amount at 31 March 2010 487 175 662 393 86 92 1,233
Other acquisition intangibles include trademarks and licences, trade names and completed technology.