Experian 2011 Annual Report Download - page 131
Download and view the complete annual report
Please find page 131 of the 2011 Experian annual report below. You can navigate through the pages in the report by either clicking on the pages listed below, or by using the keyword search tool below to find specific information within the annual report.-
 1
1 -
2
-
3
-
4
-
5
-
6
-
7
-
8
-
9
-
10
-
11
-
12
-
13
-
14
-
15
-
16
-
17
-
18
-
19
-
20
-
21
-
22
-
23
-
24
-
25
-
26
-
27
-
28
-
29
-
30
-
31
-
32
-
33
-
34
-
35
-
36
-
37
-
38
-
39
-
40
-
41
-
42
-
43
-
44
-
45
-
46
-
47
-
48
-
49
-
50
-
51
-
52
-
53
-
54
-
55
-
56
-
57
-
58
-
59
-
60
-
61
-
62
-
63
-
64
-
65
-
66
-
67
-
68
-
69
-
70
-
71
-
72
-
73
-
74
-
75
-
76
-
77
-
78
-
79
-
80
-
81
-
82
-
83
-
84
-
85
-
86
-
87
-
88
-
89
-
90
-
91
-
92
-
93
-
94
-
95
-
96
-
97
-
98
-
99
-
100
-
101
-
102
-
103
-
104
-
105
-
106
-
107
-
108
-
109
-
110
-
111
-
112
-
113
-
114
-
115
-
116
-
117
-
118
-
119
-
120
-
 121
121 -
 122
122 -
 123
123 -
 124
124 -
 125
125 -
 126
126 -
 127
127 -
 128
128 -
 129
129 -
 130
130 -
 131
131 -
 132
132 -
 133
133 -
 134
134 -
 135
135 -
 136
136 -
 137
137 -
 138
138 -
 139
139 -
 140
140 -
 141
141 -
142
-
143
-
144
-
145
-
146
-
147
-
148
-
149
-
150
-
151
-
152
-
153
-
154
-
155
-
156
-
157
-
158
-
159
-
160
-
161
-
162
-
163
-
164
 |
 |

Financial statements 129
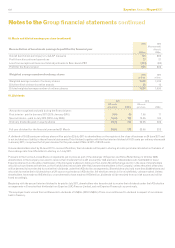
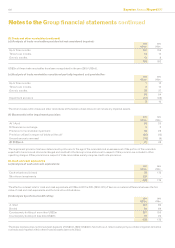
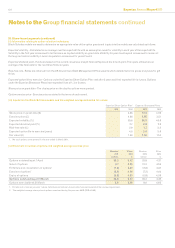
27. Trade and other payables
Current
2011
US$m
Non-current
2011
US$m
Current
2010
US$m
Non-current
2010
US$m
Trade payables 134 - 110 -
VAT and other taxes payable 40 - 31 -
Social security costs 92 - 95 -
Accruals and deferred income 819 21 767 8
Other payables 95 - 59 6
1,180 21 1,062 14
The accounting policies for other nancial liabilities have been applied to nancial instruments of US$818m (2010: US$773m) within the above
items. VAT and other taxes payable of US$40m (2010: US$31m), social security costs of US$92m (2010: US$95m) and accruals and deferred
income of US$251m (2010: US$177m) are not regarded as nancial instruments.
There is no material difference between the fair value of trade and other payables and the book value stated above. All the non-current trade and
other payables are due within ve years from the balance sheet date.
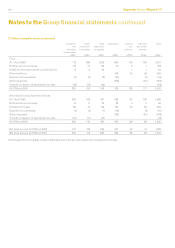
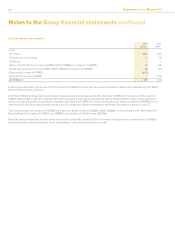
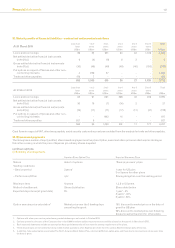
28. Loans and borrowings
(a) Analysis of loans and borrowings:
Current
2011
US$m
Non-current
2011
US$m
Current
2010
US$m
Non-current
2010
US$m
£334m 5.625% Euronotes 2013 - 576 - 552
£400m 4.75% Euronotes 2018 - 642 - -
€500m 4.75% Euronotes 2020 - 701 - 681
Bank loans 3 1 - 598
Bank overdrafts - - 12 -
Finance lease obligations 3 1 5 3
6 1,921 17 1,834
There is no material difference between the carrying values of the Group’s loans and borrowings and their fair values.
During the year ended 31 March 2011, the Group issued bonds with a nominal value of £400m. During the year ended 31 March 2010, the Group
issued bonds with a nominal value of €500m and redeemed bonds with a nominal value of £203m.
The effective interest rates for bonds approximate to the coupon rates indicated above.
Other than nance lease obligations, the borrowings of the Group are unsecured.
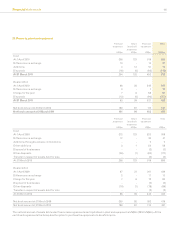
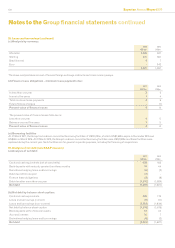
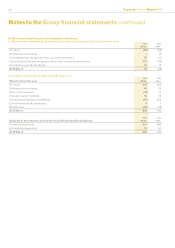
(b) Analysis by contractual repricing dates:
2011
US$m
2010
US$m
Less than one year 8615
One to two years -3
Two to three years 576 -
Three to four years - 552
Over ve years 1,343 681
1,927 1,851