Experian 2011 Annual Report Download - page 84
Download and view the complete annual report
Please find page 84 of the 2011 Experian annual report below. You can navigate through the pages in the report by either clicking on the pages listed below, or by using the keyword search tool below to find specific information within the annual report.-
 1
1 -
2
-
3
-
4
-
5
-
6
-
7
-
8
-
9
-
10
-
11
-
12
-
13
-
14
-
15
-
16
-
17
-
18
-
19
-
20
-
21
-
22
-
23
-
24
-
25
-
26
-
27
-
28
-
29
-
30
-
31
-
32
-
33
-
34
-
35
-
36
-
37
-
38
-
39
-
40
-
41
-
42
-
43
-
44
-
45
-
46
-
47
-
48
-
49
-
50
-
51
-
52
-
53
-
54
-
55
-
56
-
57
-
58
-
59
-
60
-
61
-
62
-
63
-
64
-
65
-
66
-
67
-
68
-
69
-
70
-
71
-
72
-
73
-
 74
74 -
 75
75 -
 76
76 -
 77
77 -
 78
78 -
 79
79 -
 80
80 -
 81
81 -
 82
82 -
 83
83 -
 84
84 -
 85
85 -
 86
86 -
 87
87 -
 88
88 -
 89
89 -
 90
90 -
 91
91 -
 92
92 -
 93
93 -
 94
94 -
95
-
96
-
97
-
98
-
99
-
100
-
101
-
102
-
103
-
104
-
105
-
106
-
107
-
108
-
109
-
110
-
111
-
112
-
113
-
114
-
115
-
116
-
117
-
118
-
119
-
120
-
121
-
122
-
123
-
124
-
125
-
126
-
127
-
128
-
129
-
130
-
131
-
132
-
133
-
134
-
135
-
136
-
137
-
138
-
139
-
140
-
141
-
142
-
143
-
144
-
145
-
146
-
147
-
148
-
149
-
150
-
151
-
152
-
153
-
154
-
155
-
156
-
157
-
158
-
159
-
160
-
161
-
162
-
163
-
164
 |
 |
82 Experian Annual Report 2011
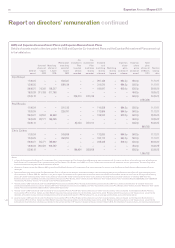
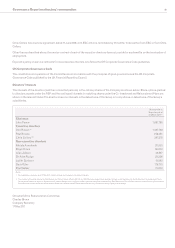
As reported last year, the Committee tested the PBT performance condition, at the end of the performance period in March 2009, and
determined that Experian’s average annual growth in PBT over this period was 13.2% and, as a result, 92% of the awards subject to this
performance condition will vest on the applicable vesting dates. Details of the number of shares which were released to the executive
directors during the year ended 31 March 2011 are given in the table entitled ‘GUS and Experian Co-investment Plans and Experian
Reinvestment Plans’.
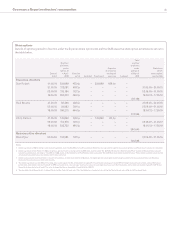
GUS Co-investment Plan
The executive directors elected to defer their entire bonus for the year ended 31 March 2007 into Experian shares, under the GUS
Co-investment Plan, and as a result were eligible to receive an award of matching shares which would vest after three years, subject to
the retention of the invested shares and continued employment. These awards vested on 29 June 2010 and details of the number of shares
released to each director are given in the table entitled ‘GUS and Experian Co-investment Plans and Experian Reinvestment Plans’.
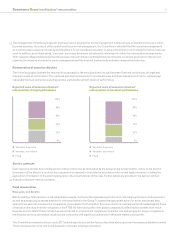
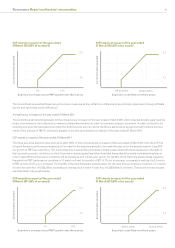
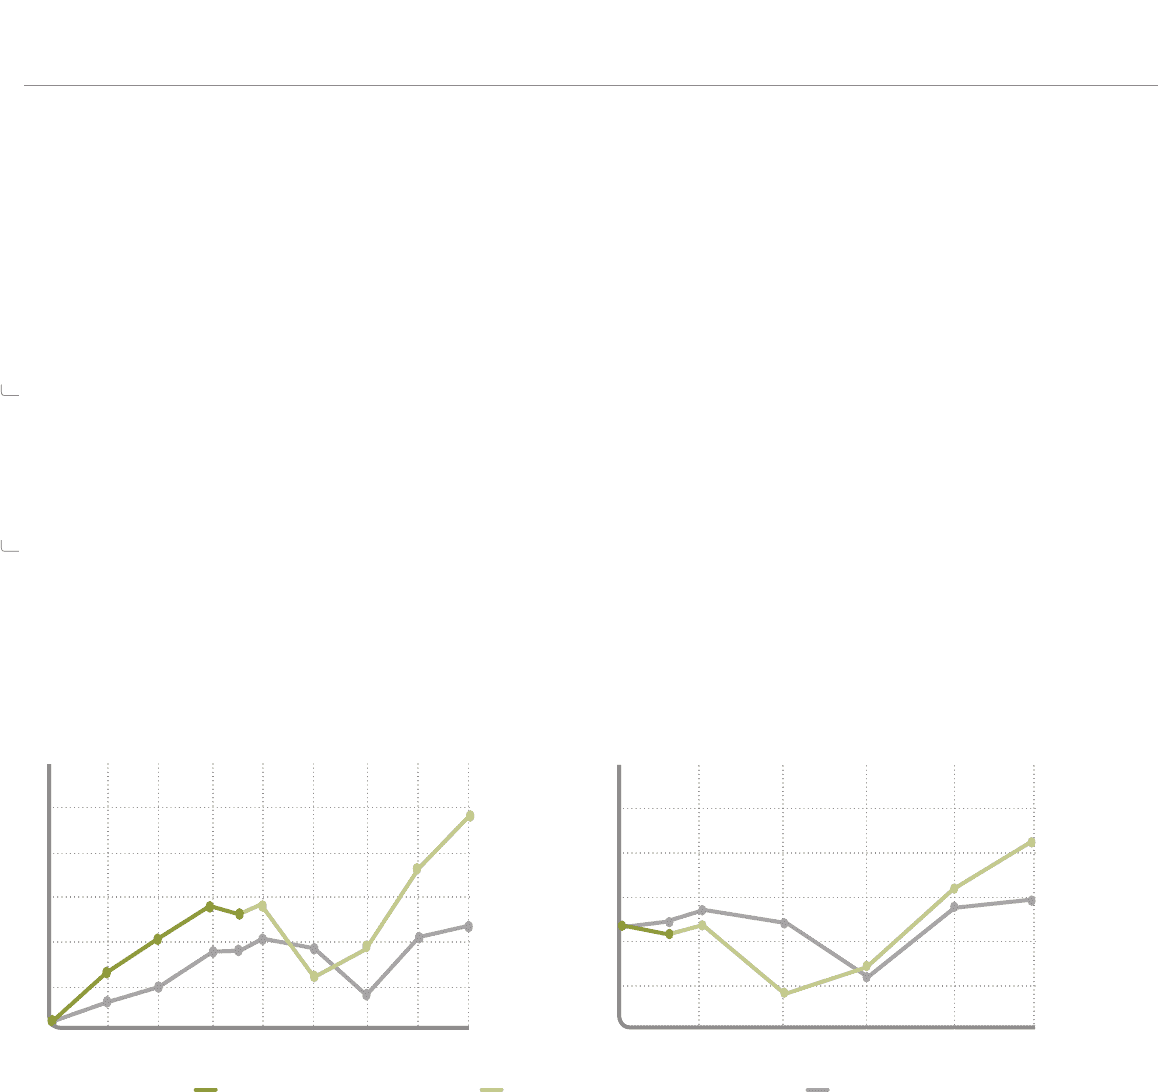
Performance graph
The Committee has chosen to illustrate the TSR for GUS plc until demerger and Experian plc for the period since listing on 11 October 2006
to 31 March 2011 against the FTSE 100 Index. The FTSE 100 Index is the most appropriate index against which TSR should be measured as it
is a widely used and understood index of which Experian is a constituent.
Performance as GUS (to 6 October 2006) Performance as Experian (from 6 October 2006) FTSE100 Index
The above graphs show that, at 31 March 2011, a hypothetical £100 invested in GUS, and subsequently Experian, would have generated a
total return of £339 compared with a return of £210 if invested in the FTSE 100 Index on 31 March 2003, and a total return of £146 compared
with a return of £118 if invested on 31 March 2006.
Shareholding guideline
The Committee believes that it is important that executives build up a significant holding in Experian shares to align their interests with
those of shareholders. Therefore, the Committee has established guidelines under which the CEO should hold the equivalent of two times
his base salary in Experian shares and other executive directors one times their base salary (including invested shares held under the CIP).
Each of the executive directors meets these guidelines.
Report on directors’ remuneration continued
March 03 March 04 March 05 March 06 March 07 March 08 March 09 March 10 March 11
Value of £100 invested in GUS/Experian
and the FTSE100 on 31 March 2003
Value of £100 invested in GUS/Experian
and the FTSE100 on 31 March 2006
Value of £100 invested in March 2006
Value of £100 invested in March 2003
£160
£140
£120
£100
£80
£60
£350
£300
£250
£200
£150
£100
86
86
March 06 March 07 March 08 March 09 March 10 March 11