Experian 2011 Annual Report Download - page 125
Download and view the complete annual report
Please find page 125 of the 2011 Experian annual report below. You can navigate through the pages in the report by either clicking on the pages listed below, or by using the keyword search tool below to find specific information within the annual report.-
 1
1 -
2
-
3
-
4
-
5
-
6
-
7
-
8
-
9
-
10
-
11
-
12
-
13
-
14
-
15
-
16
-
17
-
18
-
19
-
20
-
21
-
22
-
23
-
24
-
25
-
26
-
27
-
28
-
29
-
30
-
31
-
32
-
33
-
34
-
35
-
36
-
37
-
38
-
39
-
40
-
41
-
42
-
43
-
44
-
45
-
46
-
47
-
48
-
49
-
50
-
51
-
52
-
53
-
54
-
55
-
56
-
57
-
58
-
59
-
60
-
61
-
62
-
63
-
64
-
65
-
66
-
67
-
68
-
69
-
70
-
71
-
72
-
73
-
74
-
75
-
76
-
77
-
78
-
79
-
80
-
81
-
82
-
83
-
84
-
85
-
86
-
87
-
88
-
89
-
90
-
91
-
92
-
93
-
94
-
95
-
96
-
97
-
98
-
99
-
100
-
101
-
102
-
103
-
104
-
105
-
106
-
107
-
108
-
109
-
110
-
111
-
112
-
113
-
114
-
 115
115 -
 116
116 -
 117
117 -
 118
118 -
 119
119 -
 120
120 -
 121
121 -
 122
122 -
 123
123 -
 124
124 -
 125
125 -
 126
126 -
 127
127 -
 128
128 -
 129
129 -
 130
130 -
 131
131 -
 132
132 -
 133
133 -
 134
134 -
 135
135 -
136
-
137
-
138
-
139
-
140
-
141
-
142
-
143
-
144
-
145
-
146
-
147
-
148
-
149
-
150
-
151
-
152
-
153
-
154
-
155
-
156
-
157
-
158
-
159
-
160
-
161
-
162
-
163
-
164
 |
 |

Financial statements 123
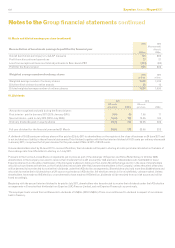
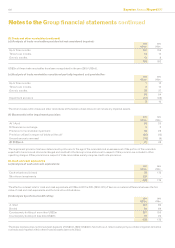
20. Goodwill
(a) Movements in goodwill:
2011
US$m
2010
US$m
At 1 April 3,412 3,125
Differences on exchange 144 278
Additions through business combinations (note 40) 205 11
Disposals - (2)
At 31 March 3,761 3,412
Additions through business combinations are stated after an increase in goodwill of US$4m (2010: decrease of US$5m) in respect of
adjustments to contingent consideration on prior year acquisitions.
(b) Analysis of allocation of goodwill by CGU:
2011
US$m
2010
US$m
North America 1,675 1,531
Latin America 1,116 1,017
UK and Ireland 611 570
EMEA 270 254
Asia Pacic 89 40
At 31 March 3,761 3,412
Further details of the principles used in determining the basis of allocation by CGU and annual impairment testing are given in note 6. There
have been no impairments of goodwill in the current or prior years.
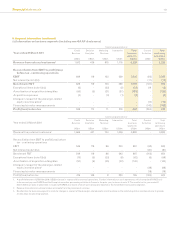
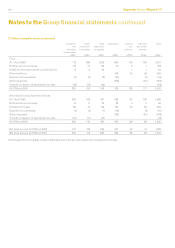
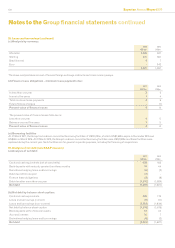
21. Other intangible assets
Customer
and
advertiser
relationships
US$m
Other
acquisition
intangibles
US$m
Total
acquisition
intangibles
US$m
Databases
US$m
Internal
use
software
US$m
Internally
generated
software
US$m
Total
US$m
Cost
At 1 April 2010 825 318 1,143 918 195 177 2,433
Differences on exchange 41 19 60 39 10 7 116
Additions through business combinations
(note 40) 64 52 116 - - 1 117
Other additions - - - 175 48 77 300
Disposals (2) (9) (11) (93) (25) (6) (135)
At 31 March 2011 928 380 1,308 1,039 228 256 2,831
Amortisation and impairment losses
At 1 April 2010 338 143 481 525 109 85 1,200
Differences on exchange 13 8 21 24 5 4 54
Charge for the year 85 44 129 154 29 24 336
Disposals (2) (9) (11) (92) (25) (5) (133)
At 31 March 2011 434 186 620 611 118 108 1,457
Net book amount at 31 March 2010 487 175 662 393 86 92 1,233
Net book amount at 31 March 2011 494 194 688 428 110 148 1,374
Other acquisition intangibles include trademarks and licences, trade names and completed technology.