Experian 2011 Annual Report Download - page 112
Download and view the complete annual report
Please find page 112 of the 2011 Experian annual report below. You can navigate through the pages in the report by either clicking on the pages listed below, or by using the keyword search tool below to find specific information within the annual report.-
 1
1 -
2
-
3
-
4
-
5
-
6
-
7
-
8
-
9
-
10
-
11
-
12
-
13
-
14
-
15
-
16
-
17
-
18
-
19
-
20
-
21
-
22
-
23
-
24
-
25
-
26
-
27
-
28
-
29
-
30
-
31
-
32
-
33
-
34
-
35
-
36
-
37
-
38
-
39
-
40
-
41
-
42
-
43
-
44
-
45
-
46
-
47
-
48
-
49
-
50
-
51
-
52
-
53
-
54
-
55
-
56
-
57
-
58
-
59
-
60
-
61
-
62
-
63
-
64
-
65
-
66
-
67
-
68
-
69
-
70
-
71
-
72
-
73
-
74
-
75
-
76
-
77
-
78
-
79
-
80
-
81
-
82
-
83
-
84
-
85
-
86
-
87
-
88
-
89
-
90
-
91
-
92
-
93
-
94
-
95
-
96
-
97
-
98
-
99
-
100
-
101
-
 102
102 -
 103
103 -
 104
104 -
 105
105 -
 106
106 -
 107
107 -
 108
108 -
 109
109 -
 110
110 -
 111
111 -
 112
112 -
 113
113 -
 114
114 -
 115
115 -
 116
116 -
 117
117 -
 118
118 -
 119
119 -
 120
120 -
 121
121 -
 122
122 -
123
-
124
-
125
-
126
-
127
-
128
-
129
-
130
-
131
-
132
-
133
-
134
-
135
-
136
-
137
-
138
-
139
-
140
-
141
-
142
-
143
-
144
-
145
-
146
-
147
-
148
-
149
-
150
-
151
-
152
-
153
-
154
-
155
-
156
-
157
-
158
-
159
-
160
-
161
-
162
-
163
-
164
 |
 |

110 Experian Annual Report 2011
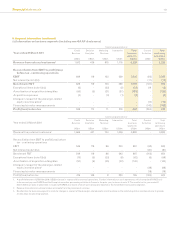
Notes to the Group nancial statements continued
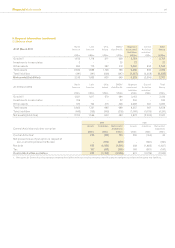
9. Segment information (continued)
The North America and the UK and Ireland operating segments derive revenues from all of the Group’s business segments. The Latin America,
EMEA and Asia Pacic segments currently do not derive revenue from the Interactive business segment.
Segment information for the full year provided to the chief operating decision maker, and reportable under IFRS 8, is set out in section (b) below.
(b) IFRS 8 disclosures – nancial information
(i) Income statement
Continuing operations1
Year ended 31 March 2011 North
America
US$m
Latin
America
US$m
UK &
Ireland
US$m
EMEA/
Asia Pacic
US$m
Total
operating
segments
US$m
Central
Activities
US$m
Total
continuing
operations
US$m
Revenue from external customers22,254 722 747 516 4,239 - 4,239
Reconciliation from EBIT to prot/(loss)
before tax - continuing operations
EBIT 610 235 212 53 1,110 (66) 1,044
Net interest (note 14(b)) - - - - - (71) (71)
Benchmark PBT 610 235 212 53 1,110 (137) 973
Exceptional items (note 13(a)) (5) - 4 (6) (7) 5 (2)
Amortisation of acquisition intangibles (52) (43) (18) (16) (129) - (129)
Acquisition expenses (2) (4) (1) (1) (8) - (8)
Charges in respect of the demerger-related
equity incentive plans (5) - (4) (1) (10) (3) (13)
Financing fair value remeasurements - - - - - (142) (142)
Prot/(loss) before tax 546 188 193 29 956 (277) 679
Continuing operations1
Year ended 31 March 2010 North
America
US$m
Latin
America
US$m
UK &
Ireland
US$m
EMEA/
Asia Pacic
US$m
Total
operating
segments
US$m
Central
Activities
US$m
Total
continuing
operations
US$m
Revenue from external customers22,068 559 792 461 3,880 - 3,880
Reconciliation from EBIT to prot/(loss) before
tax – continuing operations
EBIT 567 166 212 52 997 (62) 935
Net interest (note 14(b)) - - - - - (81) (81)
Benchmark PBT 567 166 212 52 997 (143) 854
Exceptional items (note 13(a)) (41) - (10) (11) (62) (6) (68)
Amortisation of acquisition intangibles (48) (39) (39) (14) (140) - (140)
Charges in respect of the demerger-related
equity incentive plans (11) - (7) (2) (20) (8) (28)
Financing fair value remeasurements - - - - - (18) (18)
Prot/(loss) before tax 467 127 156 25 775 (175) 600
1. A prot before tax of US$119m (2010: US$53m) arose in respect of discontinued operations. Further information on such operations, which comprised FARES only
in the current year and FARES and the Group’s transaction processing activities in France in the prior year, is shown in note 17. The results for the year ended 31
March 2010 have been re-presented in respect of FARES, the results of which were previously reported in the North America operating segment.
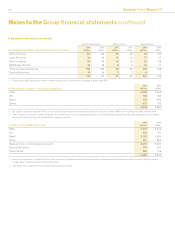
2. Revenue from external customers arose principally from the provision of services. There is no material inter-segment revenue. The analysis by business segment of
revenue from external customers is given within note 9(c).
3. Following the disposal of FARES, the Group’s share of prots and losses of associates is not material and accordingly no analysis by operating segment is provided.