Experian 2011 Annual Report Download - page 115
Download and view the complete annual report
Please find page 115 of the 2011 Experian annual report below. You can navigate through the pages in the report by either clicking on the pages listed below, or by using the keyword search tool below to find specific information within the annual report.-
 1
1 -
2
-
3
-
4
-
5
-
6
-
7
-
8
-
9
-
10
-
11
-
12
-
13
-
14
-
15
-
16
-
17
-
18
-
19
-
20
-
21
-
22
-
23
-
24
-
25
-
26
-
27
-
28
-
29
-
30
-
31
-
32
-
33
-
34
-
35
-
36
-
37
-
38
-
39
-
40
-
41
-
42
-
43
-
44
-
45
-
46
-
47
-
48
-
49
-
50
-
51
-
52
-
53
-
54
-
55
-
56
-
57
-
58
-
59
-
60
-
61
-
62
-
63
-
64
-
65
-
66
-
67
-
68
-
69
-
70
-
71
-
72
-
73
-
74
-
75
-
76
-
77
-
78
-
79
-
80
-
81
-
82
-
83
-
84
-
85
-
86
-
87
-
88
-
89
-
90
-
91
-
92
-
93
-
94
-
95
-
96
-
97
-
98
-
99
-
100
-
101
-
102
-
103
-
104
-
 105
105 -
 106
106 -
 107
107 -
 108
108 -
 109
109 -
 110
110 -
 111
111 -
 112
112 -
 113
113 -
 114
114 -
 115
115 -
 116
116 -
 117
117 -
 118
118 -
 119
119 -
 120
120 -
 121
121 -
 122
122 -
 123
123 -
 124
124 -
 125
125 -
126
-
127
-
128
-
129
-
130
-
131
-
132
-
133
-
134
-
135
-
136
-
137
-
138
-
139
-
140
-
141
-
142
-
143
-
144
-
145
-
146
-
147
-
148
-
149
-
150
-
151
-
152
-
153
-
154
-
155
-
156
-
157
-
158
-
159
-
160
-
161
-
162
-
163
-
164
 |
 |

Financial statements 113
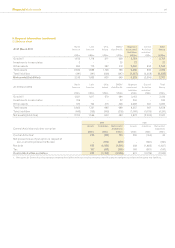
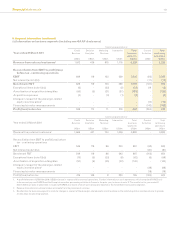
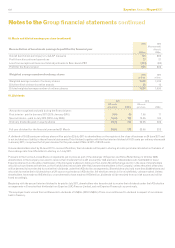
9. Segment information (continued)
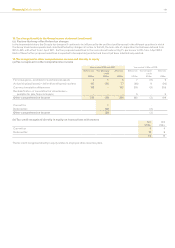
(c) Information on business segments (including non-GAAP disclosures)
Continuing operations1
Year ended 31 March 2011 Credit
Services
US$m
Decision
Analytics
US$m
Marketing
Services
US$m
Interactive
US$m
Total
business
segments
US$m
Central
Activities
US$m
Total
continuing
operations
US$m
Revenue from external customers21,812 436 815 1,176 4,239 - 4,239
Reconciliation from EBIT to prot/(loss)
before tax - continuing operations
EBIT 609 119 123 259 1,110 (66) 1,044
Net interest (note 14(b)) - - - - - (71) (71)
Benchmark PBT 609 119 123 259 1,110 (137) 973
Exceptional items (note 13(a)) (6) - (23) (2) (31) 29 (2)
Amortisation of acquisition intangibles (60) (5) (27) (37) (129) - (129)
Acquisition expenses (5) - (2) (1) (8) - (8)
Charges in respect of the demerger-related
equity incentive plans3- - - - - (13) (13)
Financing fair value remeasurements - - - - - (142) (142)
Prot/(loss) before tax 538 114 71 219 942 (263) 679
Continuing operations1
Year ended 31 March 2010 Credit
Services
US$m
Decision
Analytics
US$m
Marketing
Services
US$m
Interactive
US$m
Total
business
segments
US$m
Central
Activities
US$m
Total
continuing
operations
US$m
Revenue from external customers21,669 441 734 1,036 3,880 - 3,880
Reconciliation from EBIT to prot/(loss) before
tax - continuing operations
EBIT 549 119 86 243 997 (62) 935
Net interest (note 14(b)) - - - - - (81) (81)
Benchmark PBT 549 119 86 243 997 (143) 854
Exceptional items (note 13(a)) (16) (5) (33) (8) (62) (6) (68)
Amortisation of acquisition intangibles (57) (6) (45) (32) (140) - (140)
Charges in respect of the demerger-related
equity incentive plans3- - - - - (28) (28)
Financing fair value remeasurements - - - - - (18) (18)
Prot/(loss) before tax 476 108 8 203 795 (195) 600
1. A prot before tax of US$119m (2010: US$53m) arose in respect of discontinued operations. Further information on such operations, which comprised FARES only
in the current year and FARES and the Group’s transaction processing activities in France in the prior year, is shown in note 17. The results for the year ended 31
March 2010 have been re-presented in respect of FARES, the results of which were previously reported in the Credit Services business segment.
2. Revenue from external customers arose principally from the provision of services.
3. No allocation by business segment is made for charges in respect of the demerger-related equity incentive plans as the underlying data is maintained only to provide
an allocation by operating segment.