Experian 2011 Annual Report Download - page 16
Download and view the complete annual report
Please find page 16 of the 2011 Experian annual report below. You can navigate through the pages in the report by either clicking on the pages listed below, or by using the keyword search tool below to find specific information within the annual report.-
 1
1 -
2
-
3
-
4
-
5
-
 6
6 -
 7
7 -
 8
8 -
 9
9 -
 10
10 -
 11
11 -
 12
12 -
 13
13 -
 14
14 -
 15
15 -
 16
16 -
 17
17 -
 18
18 -
 19
19 -
 20
20 -
 21
21 -
 22
22 -
 23
23 -
 24
24 -
 25
25 -
 26
26 -
27
-
28
-
29
-
30
-
31
-
32
-
33
-
34
-
35
-
36
-
37
-
38
-
39
-
40
-
41
-
42
-
43
-
44
-
45
-
46
-
47
-
48
-
49
-
50
-
51
-
52
-
53
-
54
-
55
-
56
-
57
-
58
-
59
-
60
-
61
-
62
-
63
-
64
-
65
-
66
-
67
-
68
-
69
-
70
-
71
-
72
-
73
-
74
-
75
-
76
-
77
-
78
-
79
-
80
-
81
-
82
-
83
-
84
-
85
-
86
-
87
-
88
-
89
-
90
-
91
-
92
-
93
-
94
-
95
-
96
-
97
-
98
-
99
-
100
-
101
-
102
-
103
-
104
-
105
-
106
-
107
-
108
-
109
-
110
-
111
-
112
-
113
-
114
-
115
-
116
-
117
-
118
-
119
-
120
-
121
-
122
-
123
-
124
-
125
-
126
-
127
-
128
-
129
-
130
-
131
-
132
-
133
-
134
-
135
-
136
-
137
-
138
-
139
-
140
-
141
-
142
-
143
-
144
-
145
-
146
-
147
-
148
-
149
-
150
-
151
-
152
-
153
-
154
-
155
-
156
-
157
-
158
-
159
-
160
-
161
-
162
-
163
-
164
 |
 |

Experian Annual Report 2011
14
Employee engagement –
listening to our people
Experian’s global people survey, carried
out every 18 months, provides valuable
insights into the views of employees
and their level of engagement with the
business.
Experian’s third global people survey
in 2010 achieved 88% employee
participation, up from 84% in the
previous survey. This response level is
now considered to be ‘high performing’
and is therefore unlikely to increase
further.
The strongest results globally in
2010 were found in those areas that
employees identified as a priority for
improvement in the previous survey
(particularly Senior Leadership and
Talent Management). These were the
focus of action plans at a global and
regional level.
The question ‘I believe that action
has been taken on areas identified for
improvement in the last (2009) survey’
was a top five scoring item globally and
was one of the explicit targets set
to measure success in 2010. Experian
also scored seven percentage points
higher on this item when compared to
the external benchmark of ‘Global High
Performing Organisations’.
Overall results from the 2010 survey
showed a positive trend since the first
2007 survey, although the operational
pressures on the business resulting
from the financial downturn manifested
in slightly reduced scores in related
categories such as ‘Resources’ when
compared with 2009.
Global and regional action plans
relating to the 2010 survey are now
complete and demonstrate the strong
commitment from executive and senior
leadership to addressing issues raised
by these surveys. Plans are in place
for a quarterly review of regional and
global progress against the action plans
and the first progress review has been
conducted.
A ‘pulse’ survey was undertaken for
the first time during May 2011 to test the
effectiveness of the action plans. This
consisted of 14 questions aimed at a
random sample of employees globally.
Activity is also underway to plan for
the fourth global people survey, which
will run in November 2011. The focus for
this survey will be to continue closing
the gap between Experian’s scores
and those of global high performing
organisations. In addition, there will
again be a strong focus on whether
action has been taken on areas
identified for improvement in the last
survey results, indicating how well the
Group addresses specific employee
feedback.
More information on employee
engagement scores in Experian’s global
people surveys can be found in this
annual report in the key performance
indicators section.
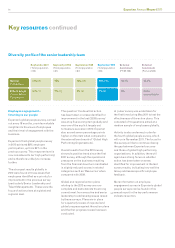
September 2007
(Total population
= 69)
September 2008
(Total population
= 87)
September 2009
(Total population
= 87)
September 2010
(Total population
= 89)
External
benchmark
(FTSE 100)
External
benchmark
(Fortune 500)
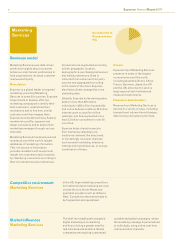
Gender
(% females)
Ethnic origin
(% non White
Caucasian)
13% (9)
10% (7)
13%
7% (6)
16% (14)
5% (4)
18% (16)
7% (6)
18.1%
5%
15.2%
Data
unavailable
Diversity profile of the senior leadership team
Key resources continued
20