Experian 2011 Annual Report Download - page 44
Download and view the complete annual report
Please find page 44 of the 2011 Experian annual report below. You can navigate through the pages in the report by either clicking on the pages listed below, or by using the keyword search tool below to find specific information within the annual report.-
 1
1 -
2
-
3
-
4
-
5
-
6
-
7
-
8
-
9
-
10
-
11
-
12
-
13
-
14
-
15
-
16
-
17
-
18
-
19
-
20
-
21
-
22
-
23
-
24
-
25
-
26
-
27
-
28
-
29
-
30
-
31
-
32
-
33
-
 34
34 -
 35
35 -
 36
36 -
 37
37 -
 38
38 -
 39
39 -
 40
40 -
 41
41 -
 42
42 -
 43
43 -
 44
44 -
 45
45 -
 46
46 -
 47
47 -
 48
48 -
 49
49 -
 50
50 -
 51
51 -
 52
52 -
 53
53 -
 54
54 -
55
-
56
-
57
-
58
-
59
-
60
-
61
-
62
-
63
-
64
-
65
-
66
-
67
-
68
-
69
-
70
-
71
-
72
-
73
-
74
-
75
-
76
-
77
-
78
-
79
-
80
-
81
-
82
-
83
-
84
-
85
-
86
-
87
-
88
-
89
-
90
-
91
-
92
-
93
-
94
-
95
-
96
-
97
-
98
-
99
-
100
-
101
-
102
-
103
-
104
-
105
-
106
-
107
-
108
-
109
-
110
-
111
-
112
-
113
-
114
-
115
-
116
-
117
-
118
-
119
-
120
-
121
-
122
-
123
-
124
-
125
-
126
-
127
-
128
-
129
-
130
-
131
-
132
-
133
-
134
-
135
-
136
-
137
-
138
-
139
-
140
-
141
-
142
-
143
-
144
-
145
-
146
-
147
-
148
-
149
-
150
-
151
-
152
-
153
-
154
-
155
-
156
-
157
-
158
-
159
-
160
-
161
-
162
-
163
-
164
 |
 |

Experian Annual Report 2011
42
Financial review
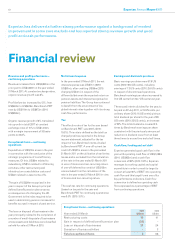
Experian has delivered a further strong performance against a background of modest
improvement in some core markets and has reported strong revenue growth and good
profit and cash performance.
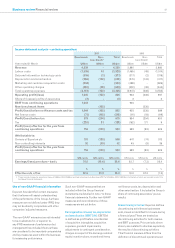
Revenue and profit performance –
continuing operations
Revenue increased from US$3,880m in the
prior year to US$4,239m in the year ended
31 March 2011. At constant exchange rates,
organic revenue growth was 8%.
Profit before tax increased by 13%, from
US$600m to US$679m. Benchmark PBT
rose by US$119m to US$973m (2010:
US$854m).
Organic revenue growth of 8% translated
into growth in total EBIT at constant
exchange rates of 10% to US$1,044m,
with a margin improvement of 30 basis
points to 24.8%.
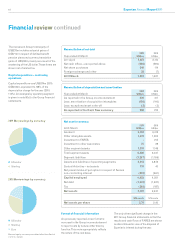
Exceptional items – continuing
operations
Expenditure of US$10m arose in the year
in connection with the conclusion of the
strategic programme of cost efficiency
measures. Of this, US$6m related to
redundancy, US$1m related to offshoring
activities, other restructuring and
infrastructure consolidation costs and
US$3m related to asset write-offs.
The gain of US$29m recognised in the
year in respect of the Group’s principal
defined benefit pension plan arose as
a consequence of a change by the UK
Government to the index required to be
used in determining pension increases for
benefits accrued in respect of past service.
The loss on disposal of businesses in the
year principally related to the completion of
a number of small disposals of businesses
whose assets and liabilities were classified
as held for sale at 31 March 2010.
Net interest expense
In the year ended 31 March 2011, the net
interest expense was US$71m (2010:
US$81m), after crediting US$6m (2010:
charging US$1m) in respect of the
differential between the expected return on
pension assets and interest recognised on
pension liabilities. The Group has continued
to benefit from the environment of low
global interest rates together with its strong
cash flow performance.
Tax
The effective rate of tax for the year based
on Benchmark PBT was 22.6% (2010:
19.0%). This rate is defined as the total tax
charge/(credit) as reported in the Group
income statement, adjusted for the tax
impact of non-Benchmark items, divided
by Benchmark PBT. A one-off current tax
credit of US$37m arose in the year ended
31 March 2011 on the utilisation of earlier tax
losses and is excluded from the calculation
of the rate in the year ended 31 March 2011
in view of its size and non-recurring nature.
A one-off deferred tax credit of US$105m
was excluded from the calculation of the
rate in the year ended 31 March 2010 in view
of its size and non-recurring nature.
The cash tax rate for continuing operations
(based on tax paid in the year and
Benchmark PBT for continuing operations)
was 9.0% (2010: 3.0%).
Earnings and dividends per share
Basic earnings per share were 57.9 US
cents (2010: 59.0 US cents), including
earnings of 7.3 US cents (2010: 2.6 US cents)
in respect of discontinued operations.
Benchmark earnings per share increased to
70.0 US cents from 63.7 US cents last year.
The second interim dividend for the year, to
be paid on 22 July 2011, is 19 US cents per
ordinary share (2010: 16 US cents) giving a
total dividend per share for the year of 28
US cents (2010: 23 US cents), an increase
of 22%. The total dividend is covered 2.5
times by Benchmark earnings per share
consistent with the previously announced
reduction in dividend cover from at least
three times to around two and a half times.
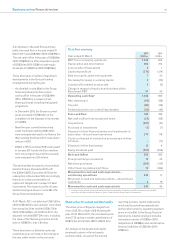
Cash flow, funding and net debt
Experian generated good cash flow in the
year with operating cash flow of US$1,028m
(2010: US$935m) and a cash flow
conversion of 98% (2010: 100%). Experian
manages its working capital and capital
expenditure in order to meet its target to
convert at least 90% of EBIT into operating
cash flow and this target forms one of its
key performance indicators. Cash flow
conversion is defined as operating cash
flow expressed as a percentage of EBIT
from continuing operations.
Exceptional items - continuing operations
Year ended 31 March 2011
US$m 2010
US$m
Restructuring costs 10 41
Gain in respect of defined benefit pension plan (29) -
Loss on disposal of businesses 21 24
Cessation of bureau activities -3
Total exceptional items 2 68